
Category — zzz. Stuff No One Cares About but Me
Disney World and Coronavirus
WALT DISNEY WORLD IN THE ERA OF CORONAVIRUS
Last updated 3/22 11a EST.
Dear Niecelet 2.0:
I’ve been having fun helping you plan your May 2020 Walt Disney World visit with the Hubs and The Beast.
Then you asked me whether the Coronavirus COVID-19 outbreak ought to affect your plans, and then Walt Disney World announced it was shutting down Monday through the end of the month, and I stopped having fun.
My best guess is that limited operation will being no earlier than Monday May 4…
As you know, I have neither clinical qualifications nor epidemiology training.
But I do have a Twitter account, and from what I can see, that apparently qualifies me to pronounce on the novel Coronavirus, and the illness associated with it, COVID-19.
So here’s some thoughts…
CORONAVIRUS COVID-19 AND WALT DISNEY WORLD: THE BASICS
Last year the U.S. saw about 2.8 million deaths, and in February there were about 5.8 million unemployed.
What will the equivalent numbers be at the end of 2020? Well, that’s kind of up to you.
Take care of others. In the absence of perfect knowledge about your infectious status—which we will never have, as even if you were tested today, you might get infected tomorrow—the ethical thing to do is to act as though you have the disease. The central point is to maintain social distance, especially in settings when you will be with (relative) strangers.
The vast majority of folks who get the disease will recover after mild or unnoticed symptoms, but some folks—especially the elderly, and those with heart disease, diabetes, lung disease, or a compromised immune system—can be horribly vulnerable. (In South Korea, 89% of deaths have been from those 60 and older, and 97.4% of deaths from those 50 and older. China data, which is less complete, shows 81% of deaths from those 60 and older, and 94% of deaths from those 50 and older.) When you see others, you can’t assume that you know the vulnerability of either them or those they are in close contact with. So act as though you are infectious, and act as though those around you are at risk, by maintaining social distancing.
As much as possible, don’t separate yourself from the economy. If you spend less, other people take in less. Then they spend less. And so it goes, and the economy tanks, and a lot of people lose their jobs. Go to the movies if they are still open (while maintaining social distance). Spend some money. It’ll be OK. And if you have liquidity in your retirement plan, buy stocks. Don’t sell them—at your age (even at my age…) that’s what fools do. The rule is sell high, and buy low. Fools do the opposite.
There is much energy that has emerged over the weekend to “just stay home.” The death rate per million people–so far–ranges at the country level from around 2 deaths per million people in South Korea, to 2.3 per million in China, and to 80 deaths per million and rising in Italy. In an average year, each of these countries sees on the order of 7,000 to 9,000 deaths per million people. So the actual increment to what is typical is not a very large number, especially for China, which is pretty much done with the disease–at least so far…
Our policy makers are advising us more and more in the U.S. to just stay home as well. Where we diverge, pay attention to the policy makers, not your uncle!!
Of course if you are diagnosed, this all changes. If you actually have the disease, stay home unless a health care professional indicates that you are one of the 15-20% of people sick enough to be hospitalized.
Take care of yourself. The most important thing you can do is frequent, effective hand washing. There is much fussing about the shortage of hand sanitizers. Carry hand sanitizers (and surface sanitizers) if you can, but remember that soap and water, even cold water, when properly applied and properly scrubbed, is totally effective. Carry a bar of soap with you. Moreover, as you know from the fact that one of your extended family is immuno-compromised, when you have the choice, soap and water, when done correctly, is more effective than hand sanitizers.
One of the poignancies of the present moment is that heightened action led by panic is good for epidemics but bad for people’s jobs. Heightened panic that leads to a lot of extra social distancing, hand washing, and other measures protective of others or yourself will limit the impact of the pandemic at any given moment, reducing the burden of disease on our people and the risk of overwhelming our health care system. But panic as applied to economic activities does not have this positive result. It has really bad results. So find the line where you take care of both your health and the health and jobs of your fellow citizens.
And especially don’t panic over kids. Lotsa places are closing schools. That’s not because kids are vulnerable—unusually for respiratory diseases, they aren’t. None of China’s deaths into February were of kids. None of South Korea’s deaths through yesterday were of kids.
And it does not seem that kids even get the disease at particularly high rates, although there is contention over this. The Diamond Princess epidemiology—the only 100% testing regimen we may ever get on this disease—suggested that kids get infected at the same rate as everyone else. In contrast, simple algebra applied to the South Korea data suggests kids 0-9 years old get the disease at a rate of about 20 cases per million, or about one in 50,000 kids, while everyone else in South Korea gets the disease at a rate of about 171 per million, or about one in 6,000 folks 10 and older. However, the Diamond Princess was an artificial hothouse of infection, so a Bayesian would put the predominant weight of his or her prior on the South Korean data.
The issue with kids is their lousy ability to implement social distance, sneeze hygiene, and the like, especially around their grandparents. Removing them from mixing in masses with other kids in classrooms, school cafeterias, recesses, and buses limits their probably already low chance of getting the disease, which limits their chance of spreading the disease.
CORONAVIRUS AND WALT DISNEY WORLD: YOUR FAMILY AND SOME NUMBERS
There are some really silly numbers out there, mostly well-intended. Numbers that should be posed as “might be, based on the assumptions of our model, if there is no action by anyone” get converted into statements about what the future will be. And hardly anyone but professionals is framing their statements to the true probability ranges of their estimates—and some professionals aren’t even doing that.
Professionals need to model as best they can, even with limitations on present data and imperfect historical analogies. This gives them a range of possible outcomes if there is no material mitigation, and then also a range of possible outcomes after interventions of various degrees of effectiveness (interventions include not just what the government does, but also and much more importantly what you do—remember that what happens next is up to you).
They can then use their model outputs to persuade policy makers and the American people why they should do such things as encourage people to commit to social distancing, close schools, etc.
However, there are some problems with this. Many people—even the best analysts—are not as good as they should be at recognizing that when they are working with samples (either of data or of historical analogies), that the range of “all possible outcomes” is usually much wider than their samples would lead them to first think.
Another key other problem is that intrinsic to epidemiologic modeling are uncertain parameters and exponential curves of growth. Anyone who has ever built such a model understands how wildly sensitive they are to the assumptions used to create them.
That means that good models present such a wide range of possible outcomes that, to those who are not sophisticated on these matters, which is almost all of us, the results don’t appear credible. The uncertainty is real, and is a result of not bad modeling, but good modeling.
Finally, even good modeling can be communicated badly. That happened this week in Ohio. Amy Acton, M.D., the Director of Ohio’s Department of Health—who I think the world of, and am thrilled is leading Ohio’s efforts—said Thursday that “We know now, just the fact of community spread, says that at least 1 percent, at the very least, 1 percent of our population is carrying this virus in Ohio today. We have 11.7 million people. So the math is over 100,000. So that just gives you a sense of how this virus spreads and is spreading quickly.”
Many of those literate in math and the state of the disease elsewhere were immediately enboggled. Ohio has therefore more cases as China, which has been fighting this disease for months? Now, I know that China has particularly bad incidence reporting, but let’s say that there are four times as many people who got the disease as China as reported—that would put the number in China, a country of 1.4 billion people which essentially spent a month doing nothing, at 325,000. So Ohio, with 0.85% of the population of China, has 30% as many cases?
Friday she walked this back, saying “I am not saying there are absolutely for certain 100,000 people, I’m saying I’m guesstimating.” She also explained the analytics of her approach.
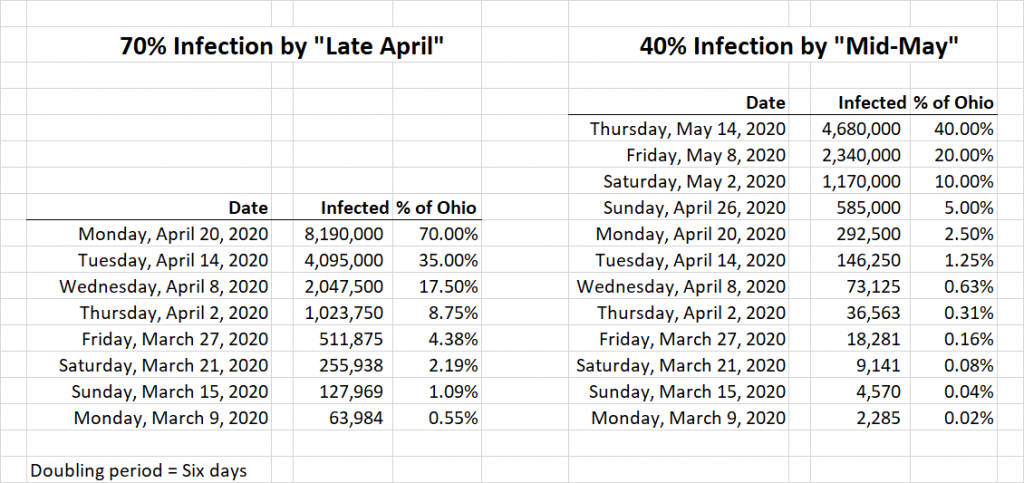
- She inferred from her conversations with many other experts that the estimated range of possible infections, if there was no intervention, was 40% to 70% of the population (you’ll see this many places, but all too often without the qualifiers “estimated” and “if there is no intervention”).
- She also inferred from many other experts that based on the timing of things in Ohio that “the peak would be in late April or early May.”
- She also inferred from many experts that the doubling period, with no intervention, was five to seven days, so she picked six days.
- She then—if I got her analytic approach right—did her math on the assumption that with no interventions 70% of the population would have the disease by late April, and cut this in half every six days until she got to March 9, which was the day she was trying to forecast.
I tried to replicate this analysis—assuming that I heard her correctly.
I got the result as being ~64,000 infected people on March 9, which is quite sensibly rounded to the 100,000 people she noted.
There’s (at least) one problem with this. The problem is that she did not articulate the uncertainty—that is the range of outcomes—of her own stated numbers. Using her same conceptual approach, but picking the two other terms she posed—a 40% infection rate with no interventions, and a mid-May peak—you get a very different answer: about 2,300 people currently infected.
But the biggest problem was the statement “We know now…that at least 1 percent of our population is carrying this virus in Ohio today.”
You can easily model the twelve scenarios that come from her three parameters (two peak dates times two peak rates times three doubling rates*).
And you will get from that work that she should have said not “we know that 1% of our population is carrying this virus today” but rather “the best model I have been able to put together predicts that there are between 300 and 120,000 people infected with this virus in Ohio today.” (The broader range comes from the other two doubling periods.)
That’s a tremendously uncomfortable range for those naive in the sensitivity of exponential models to initial assumptions. But it is probably in the neighborhood of the real uncertainty.
What does this mean for you and your family? Can I give you point forecast? Sure, but remember my qualification is a twitter handle, so take it with a huge grain of salt.
Countries well into this disease are showing a range of infections per million population from ~50 per million to 400+ per million.**
Reported infection rates are highly sensitive to testing rates, as a lot of testing will show many asymptomatic folks that will be missed from infection rates that include only limited testing (and presumptive cases from empirical diagnosis). So to fix an upper end—while making the math easier—let’s use an infection rate for the US of about double that of Italy, so 1,000 per million, or one in a thousand. So that’s your chance of getting the disease—assuming a lot of interventions by both us and those we chose to lead us, but with worse outcomes so far than others are getting.
People the age of you and your husband have, in the data from China, about a 0.2% of dying, having gotten the disease, or one in 500. So my point forecast of your chance of dying from COVID-19 is the multiplication of the one in a thousand chance of getting the infection times a one in five hundred chance of dying from the infection once you have it, or one in five hundred thousand. Note that we have not lived with this disease long enough to know much about recurrence: the likelihood of its recurrence, the virulence of its recurrence, the periodicity or seasonality of its recurrence, and the impact of any new herd immunity that will exist during those re-occurrences. So your lifetime risk of death from it is likely to be higher than this.
Those of other age groups (and those with co-morbidities) face different odds. In China, no one the age of The Beast (zero to nine years old) died in the data set that covered through February. The data from Korea shows a much lower chance of death, and that from Italy, where the natural virulence of the disease among Italy’s vast proportions of elderly had been amplified by a collapse in the capacity of its health care system, a higher chance.
Here’s the Chinese and South Korean data, as a percent and expressed as chances of dying:
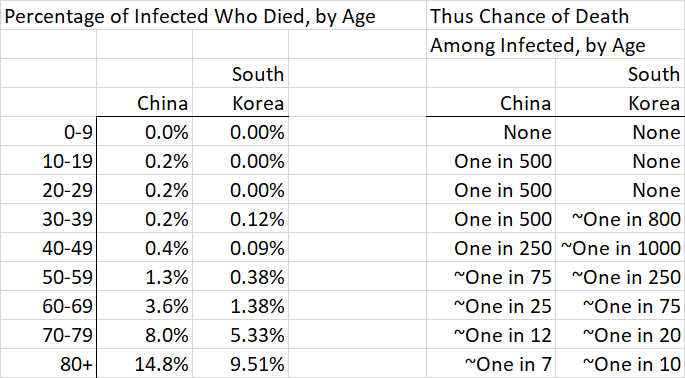
Another way to think about this. If you are under 60 you have hardly any chance of dying. If you are under 60 and have no major co-morbidities (heart or lung disease, or diabetes) then it’s even lower. So your goal is to prevent infecting those over 60, those with co-morbidities of any age, and those who might be in close contact with them. Which might be anyone…so back to social distancing.
Note that social distancing and other interventions have two different goals.
The first is to spread the burden of the disease on a population over time—thus reducing peaks. This has many positive outcomes, of which the most important is reducing the stress on the limited resources of our health care system. When we run out of resources—health care providers in general, healthy health care providers, protective gear, ventilators, respirators, safe spaces to treat people—more people die.
The second is ideally to reduce the total number of infections. Social distancing, reductions in mass gatherings, and reductions in smaller gatherings that include mixing of people who are not normally in close proximity (like school cafeteria lunches), and home quarantine for the 80% or so of people who are diagnosed but not ill enough to be hospitalized, limit the opportunity for person-to-person transmission.
While it’s pretty widely thought that we can “flatten the curve,” as it is called, from these mitigations, it’s not yet clear whether with COVID-19 we can actually limit the total number of people eventually infected. This is because it takes so long after infection for symptoms to first appear, and symptoms in so many who show them are so mild that they are not noticed. But time, even if it does not immediately reduce total infections, potentially buys us other things in addition to reducing the strain on the health care system. It lets the supply chain of protective equipment and sanitizers refill; it lets ill health care providers heal; it creates the opportunity for the virus to mutate into a less dangerous strain; it perhaps lets some herd immunity emerge.
So social distancing and other measures may or may not limit the total number of infections. What it will do—if people behave ethically–is spread the disease out in time. That—and testing—brings us back to Disney World.
CORONAVIRUS AND WALT DISNEY WORLD: TESTING
Walt Disney World, and to an extent the Walt Disney Company itself, are basically in the mass-gathering business. Think of Casey’s Corner, the tapstiles before rope drop, the stretching room at Haunted Mansion. Who woulda thunk that Disney+, conceived as a cord-cutting hedge, actually turned out to be a pandemic hedge….
My current best guess is that the only way Walt Disney World can operate while the virus is still a concern is by reducing and organizing its capacity to enable social distancing, and reducing its hours to enable overnight deep cleaning. You’ve probably seen this sort of thing already in movie theaters, where many have taken half or more of their seats out of capacity so that folks on average won’t be as close to strangers as they would have been otherwise.
This would require, I think, severe limits on entry to the parks to enforce a much lower total number of people in them, perhaps closure of some options where social distancing is hard to control (e.g. the afternoon parade at Magic Kingdom, the fireworks shows at Magic Kingdom and Epcot), and marking on the ground in the queues and waiting areas (like the pre-show areas) to indicate where groups should center themselves, so that social distancing from strangers is easy to do.
Other ideas being rumored are more use of Boarding Groups (apparently being re-named “Virtual Queues” and of course limits to the seating in table service restaurants and moving counter service restaurants to mobile orders only.
The other thing that would be of great advantage to Walt Disney World would be widespread testing that is available without a doctor’s order, that produced a dated certificate that could be displayed at the gates (and is hard to forge…). I actually hope for a day when we all wear lanyards containing a card that shows we were disease free at the time of testing, with color coding to indicate the date of testing. This would give people more courage to do the kind of things that would get the economy going again.
You could get most of the benefits from this by imposing a health check–a quick review of symptoms, travel history, and the taking of temperatures–at or before the security checks. A them park in Singapore has remained open with this approach. But that will miss the pretty high proportion of people with the disease who are asymptomatic (more than half in the Diamond Princess data, which is the only 100% sample there is).
There is, as you know, much nonsense being written about testing. Now let me be clear: more testing is better than less testing, and a lot of testing is better than some testing. But this is largely for economic, not clinical reasons, and people who confuse the two might be making foolish errors.
For example, I just saw a tweet—were it not my only qualification to be writing you, I’d be off Twitter entirely right now–that says “logic says we need universal testing but sadly that’s not happening.” Well, let’s spend a moment not being silly. South Korea, which has been universally praised for its testing levels, and held up to scorn us, has tested about 4,000 people per million population. That means that the universally praised South Korean model has NOT TESTED 99.6% of its population.
Or you see dangerous idiocies like this in an AP story about keeping the crisis from overwhelming hospitals, published a day or two ago: “How bad U.S. hospitals will be hit is unclear partly because bungling on the part of the government has left public health officials uncertain as to how many people are infected….Experts fear that when the problems with testing are resolved, a flood of patients will hit the nations emergency rooms.”
OK, let us not be silly. Testing has nothing to do with whether or not you go to an emergency room, and only a fool would suggest that it does. Just as with every other illness in the history of the universe, it is symptoms and risk factors that lead you to the health care system. If you have a fever, dry cough, or shortness of breath, call your primary care office. On that call you will be taken through your symptoms and medical history, and you will hear one of several next steps, depending on your differential diagnosis, the severity of your symptoms, and the presence or absence of other risk factors like age and key co-morbidities. These might include testing. They might include going to the emergency room. But they probably won’t, because most of us don’t have the disease, and of those that do, most don’t need to be hospitalized.
It is darling to listen to otherwise somewhat sensible reporters assume that if someone is not diagnosed via testing with COVID-19, they can’t be treated at all, as I did this evening with an NPR host. Our clinical professionals are not that stupid. If someone has signs and symptoms of respiratory distress, they will get treated for respiratory distress. If some is suffering from viral pneumonia, they will get treated for that. The cause is not a requisite to treatment. And if we are all wise enough to act on social distancing, that is, as though we carry the disease, then the presence or absence of an actual diagnosis matters much less.
What more testing, and more accessible testing, and more speedy results, could do is reduce the risks that others will be infected, and especially if results are visible, as in my lanyard notion above, they would improve the economy by improving the willingness of people to go back out into the marketplace.
More testing would yield more identification of those infected but asymptomatic, who could then be isolated at home and even more than social distancing limit their chances of infecting others; more visibility into who is demonstrably disease free (at least as of their testing date, which is why I suggested the date-of-testing color coding noted above) would improve the willingness of others to be around them.
Disney World may not be back in full routine operation until this disease has run its course—and that is more likely to be well after your May date than before your planned visit.
But it may be able to do a partial opening in April, with limited access and shorter hours (and some attractions not re-opened), so long as it can figure out a way to guide people to social distancing, e.g. by reconfigured queues, boarding groups, paint marks on the ground telling you where to center your party, etc.
Older front of the house cast members, and those with risk-creating co-morbidities, may need to be moved to the back of the house roles for their own safety, and some high-contact jobs—like the cast member in the Haunted Mansion stretching room—may not reappear.
After that, the return of Disney World—and the rest of the economy—to full operation may hinge a lot on how quickly more universal testing is available, as that is what will build confidence in people to be around strangers.
So what’s good for Disney World is good for the world…but the most important thing is that what is next is up to you.
*Since in her analytic approach, the beginning and end dates are fixed, changes in days-to-double changes the number of doubling periods. More doubling periods means fewer cases today, and fewer doubling periods means more cases today.
**Yes, I know that it is much higher in the worst-affected areas. But as a Bayesian I would start with my prior as the national rate, and then revise it up or down based on material local factors. On average across the US this is an OK place to start. The key here to keep your eye out for is if, rather than the disease disappearing from China, as it has been for weeks, if it flares up again to Wuhan levels in a new geography. That would demonstrate a much more dangerous illness.
SOME SOURCES
China data
South Korea data
Testing rates per million
Infections per million

Follow yourfirstvisit.net on Facebook or Twitter or Pinterest!!
March 15, 2020 2 Comments
Updated Disney World 2019 Price Seasons
Yesterday I published my updated material on Walt Disney World resort prices in 2019, based on my sampling (and analysis) of more than 3,200 individual hotel/date/price combinations.
The purpose of this site is to help people make better choices in their Disney World vacations, either from direct advice or from providing the facts and letting people make their own decision from them.
Disney resort hotel prices matter because the exact same room can cost 75% more depending on what nights you stay in it.
To help guide people around this without getting into the more than 30,000 individual pieces of data, my 2019 Disney World price seasons material first is a sample of half of Disney World’s hotels, and second analyzes and depicts only the least expensive room types within them.
I then show the results in two ways: charts that smooth out the changing prices by averaging prices over a seven night stay, and “invented” (I’ll return to this in a minute) “price seasons” that give a broad sense of how expensive a room is during different parts of the year. In my “seasons” I always express prices as how much higher they are than the lowest prices for that room that year.
In this post I want to explain a little about why I do it this way—and where the seasons came from. But if you don’t care and just want to see the results, go here; if you want to see every single data point, go to MouseSavers.com here.
NIGHTLY ROOM RATES
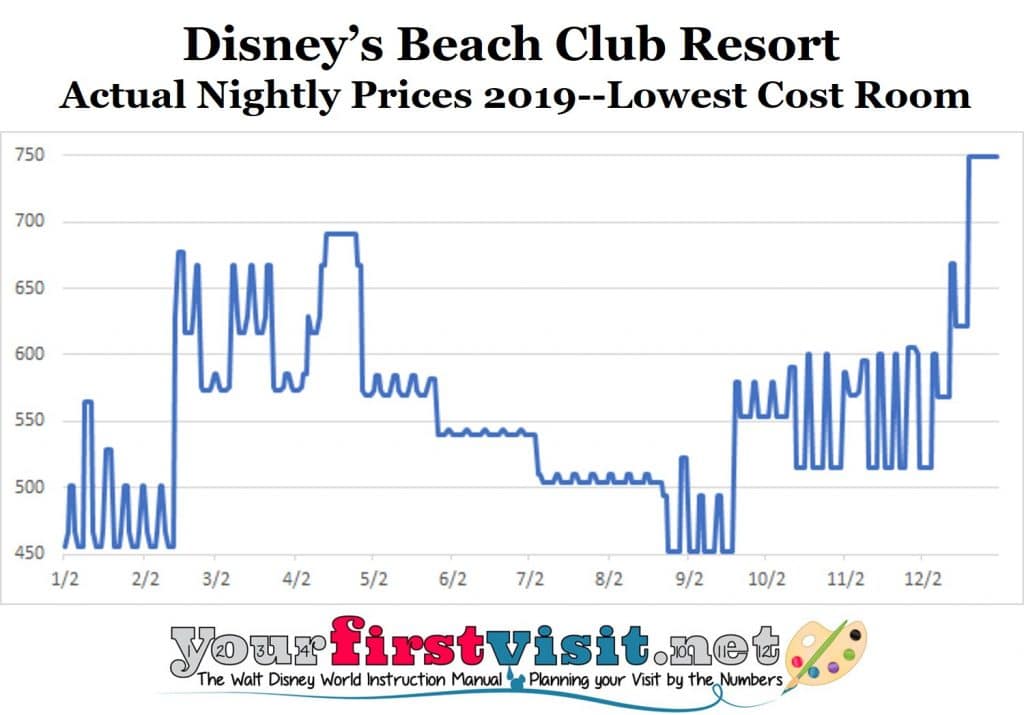 Here’s a chart of the actual rates by night in 2019 of a standard view rooms at Disney’s Beach Club resort. Note that I have truncated the lower axis at $450/night to make the patterns more readable.
While you’ll note some consistency over periods (this is where “price seasons” comes in), there’s a lot of wiggles in the line. This comes from all the different prices during the week that Disney now charges, as well as various holiday weekend upcharges.
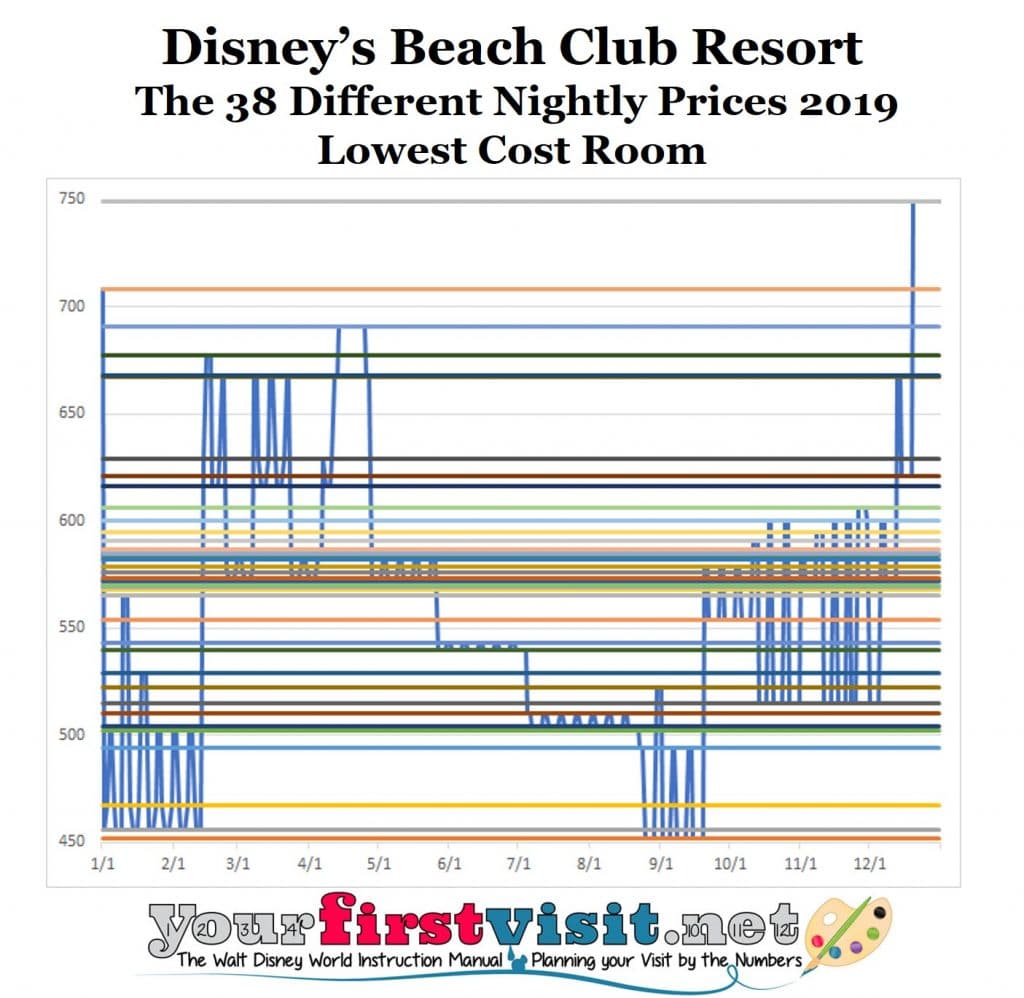
The net is 38 different prices for the same room over the course of 2019. In this chart, I have a straight line across for each of the 38 prices:
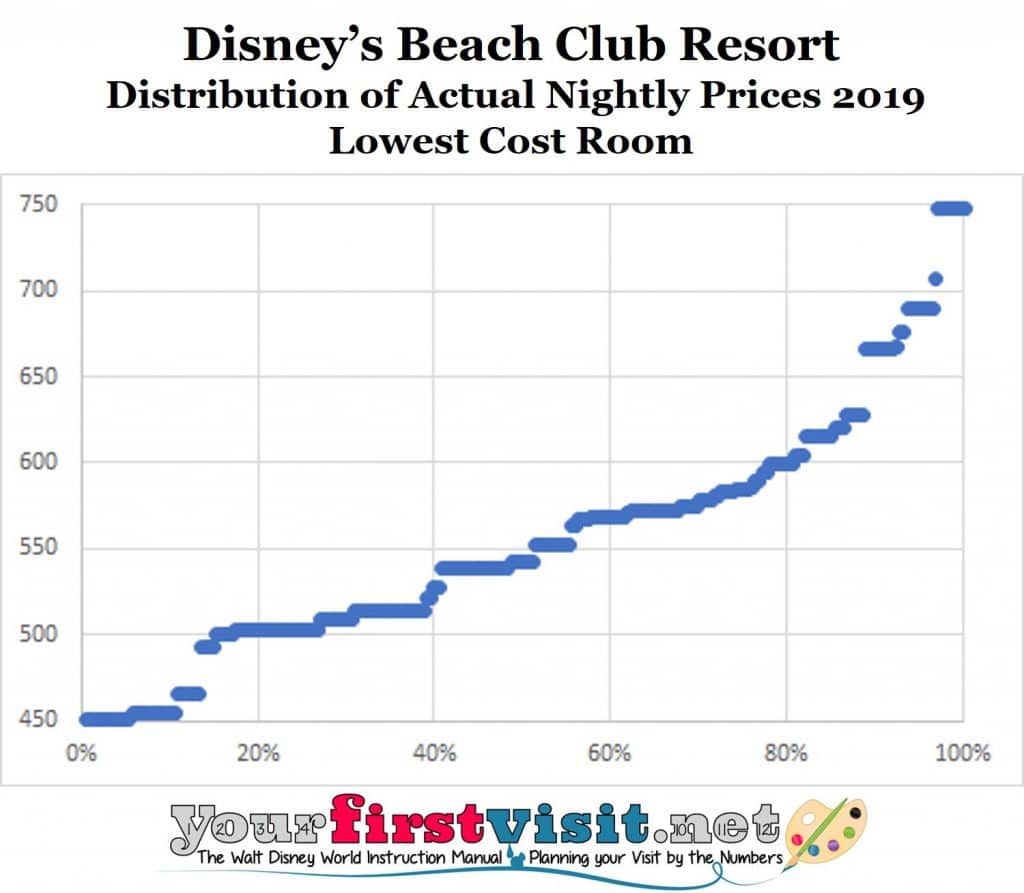
 …and in the chart below, I show the distribution of prices for this room. More than half of the nights of the year, you can get this room for $550 or less, but 20% of the nights of the year you will pay prices of $600 or much more (all my prices include tax).
 To make these price shifts a little easier to understand, I smooth them out. My smoothing approach is to average prices over seven nights—the check in night, and six more. This is what I display on my 2019 Disney World price seasons page. I pick seven nights to map to the set of prices that vary over the week but are the same the next week characteristic of many Disney World price seasons.
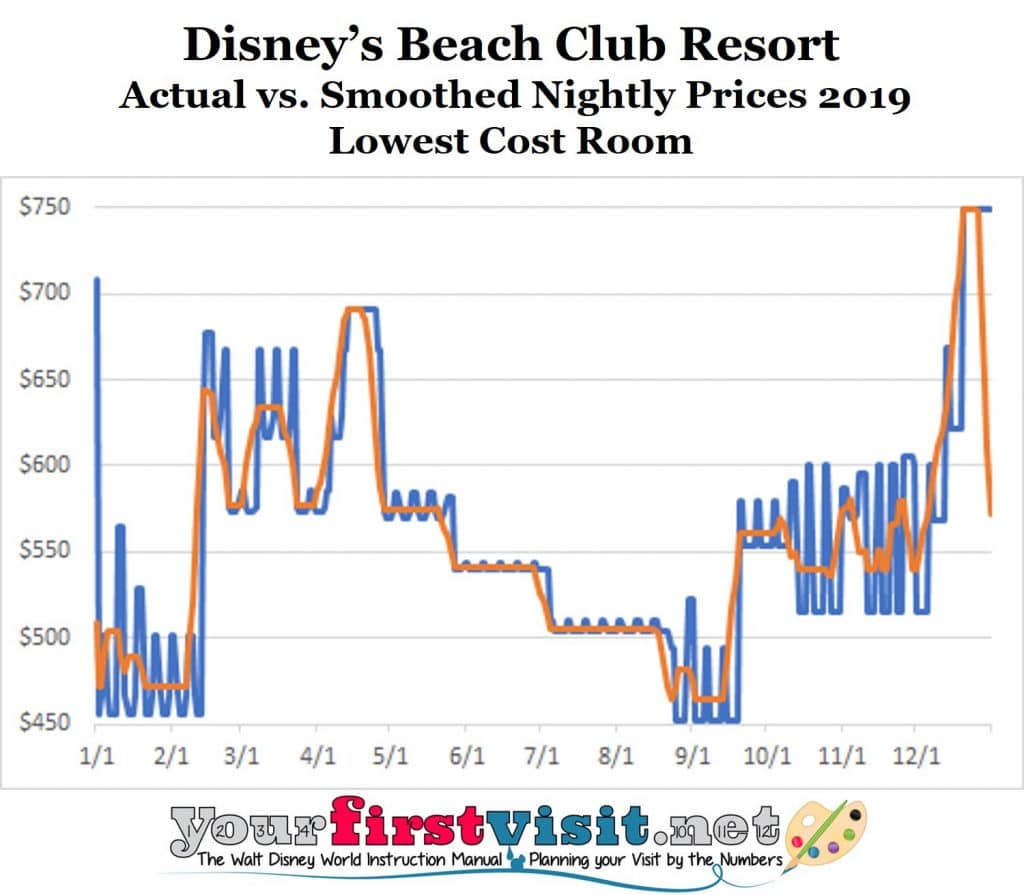 This chart shows the smoothed line (in orange) on top of the actual prices in blue. I believe that this type of smoothing makes it much easier to interpret what prices you will run into for any check in date.
DISNEY WORLD PRICE SEASONS
Disney World used to group and label periods of the year into resort “price seasons.” The traditional price season calendar would have a day or two of peak season in early January coming out of the holidays, then shift into value season, then peak again for Presidents Day week, then regular season, then a mix of regular and peak during spring break before Easter, then Easter season, in years with an early Easter some more peak seasons, then regular season, then summer season, etc.
Last year, Disney stopped labeling the parts of the year into price seasons, and added more distinct price points over the course of the year. For 2019 it continued to abandon the “season” labeling concept, and added even more distinct prices. (I’ll publish more on 2018 vs. 2019 resort prices later this summer.)
But you can still see price seasons, if you look closely enough.
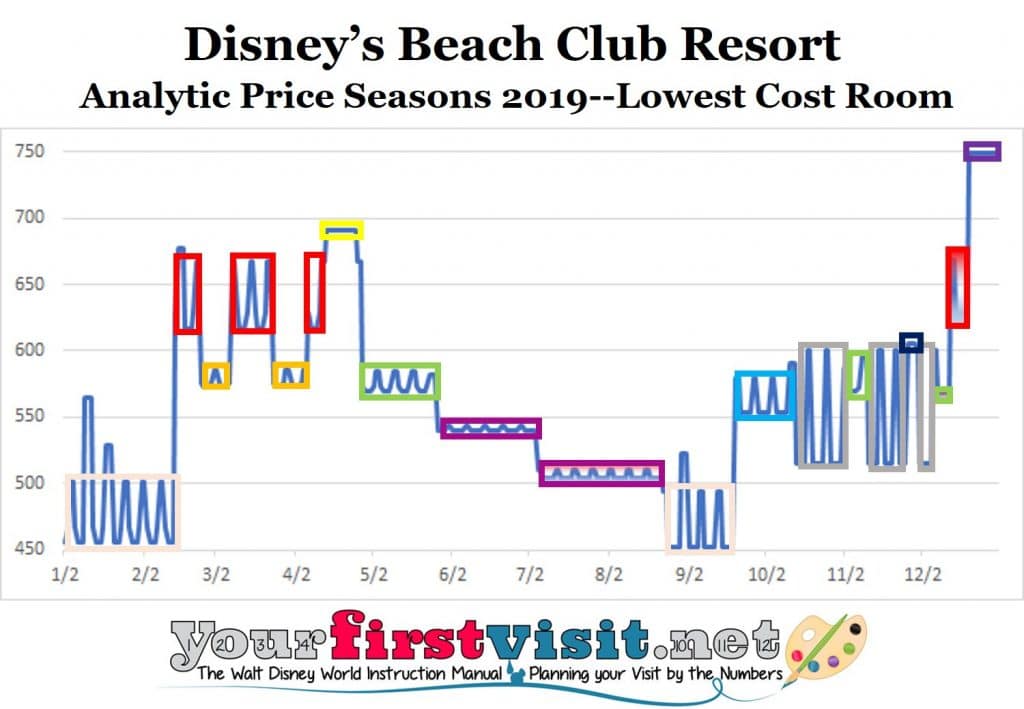 See the chart, where I have used colored boxes to group prices into seasons (ignoring holiday weekend upcharges), keeping the same color when the numbers remain the same. I have then labeled these with the traditional names—although my labels don’t always correspond to those used by MouseSavers.com.
The first box in January, in light orange, is the value season. Then we have a sequence of peak (red) and regular (orange), culminating in the Easter season in yellow. A distinct season then opens, which I call regular 2. After that are two distinct summer seasons, then the value season reappears in late August and early September.
Things then get a little confusing, but based on both this and the same charts for other deluxes, I basically see a sequence of regular variants (in blue and green) that I call regular 3, regular 4, and regular 5, alternating with the Fall season (grey) in between, interrupted by the Thanksgiving upcharge in black. Later in December peak season returns, and then we skyrocket off into the holiday seasons.
This then is the set of seasonal labels I use in my text descriptions of the 2019 Disney World resort price seasons.
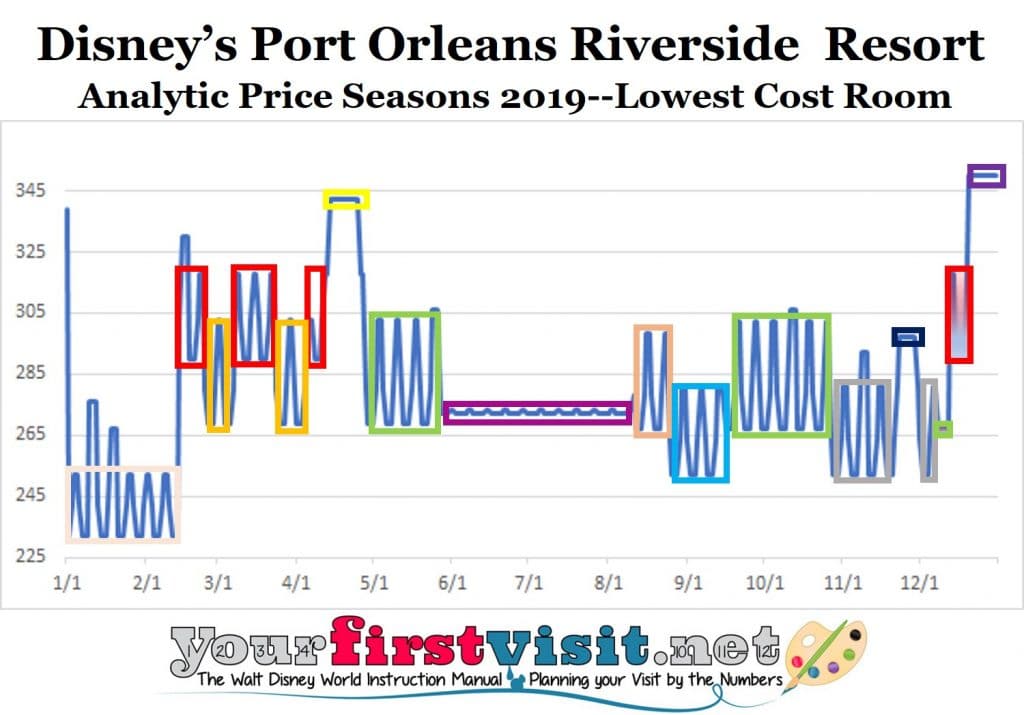
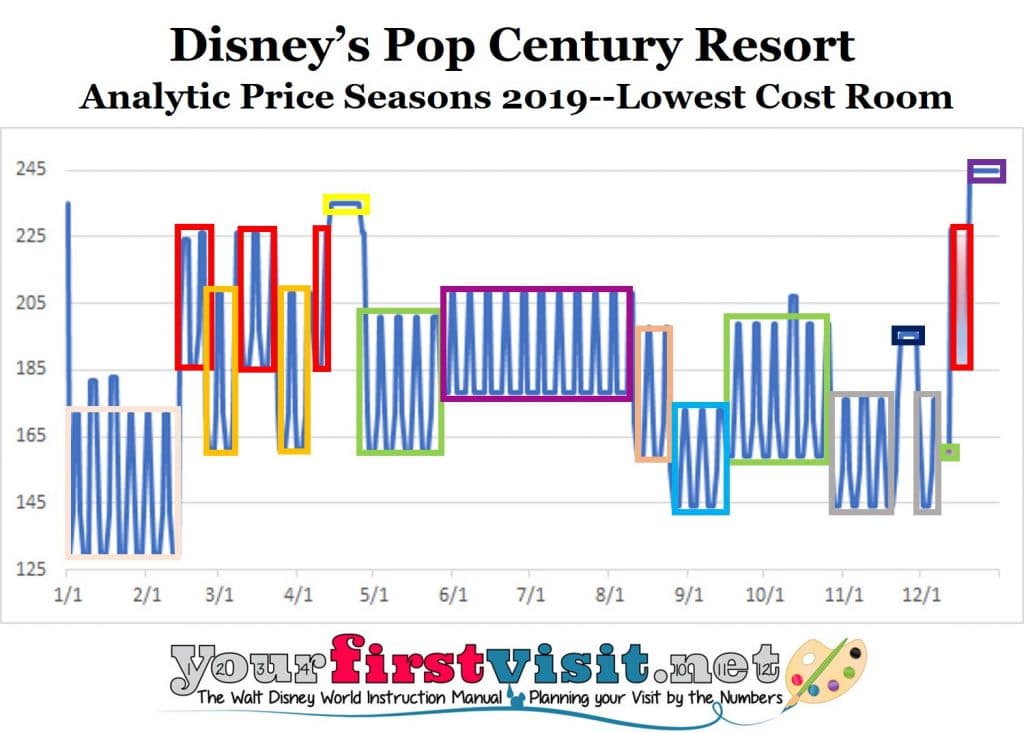
The values and moderates continue to operate to a different seasonal calendar then the deluxes between July and Thanksgiving but I did the exact same graphical analysis to uncover their seasons. Here’s an example of one of the moderates:
 …and of one of the values:
 If this is all too confusing, my travel agent partner Kelly can help you book during a lower-cost period. Contact her by using the form below.

Follow yourfirstvisit.net on Facebook or Twitter or Pinterest!!
June 25, 2018 No Comments
Length of Stay Pricing at the Disney World Resorts?
Earlier this year Disney World announced that parking at its hotels would no longer be free for reservations booked after March 20, 2018. Only slightly less controversial than that whole poenitentia vs. metanoia thing among Luther, Erasmus, and the Catholic Church, no explanation for it has been offered other than such a parking charge is common practice.
At the end of my post on the parking matter, I’d noted that “I can think of one way in which–at least in 2019–this money may make its way back into guest pockets. I’ll publish more on this thought, which has to do with length-of-stay pricing, later.”
So this is the post on that thought. What it boils down to is that if Disney institutes length of stay discounts, it would need to make a big one-time increase in room rates to keep its overall revenue whole. The increases from parking revenue could be used to offset some of that price increase.
 Note that I’m not predicting that Disney World will institute length of stay pricing—rather, this is largely a thought experiment on the implications for price increases if it chooses to do so. But we do know it is interested in increasing length of stay…
“We’ve got … a number of other plans as it relates to our hotel business. So we think that we’ve got room on pricing there. It’s not just about taking pricing up, it’s just about being more strategic at how we price, particularly how we manage demand and we’ve taken a number of steps there. We think we can expand length of stay …We have some nice pricing leverage with our hotels. We actually are comping nicely in hotel rates, particularly in Orlando as a for instance, but we have an opportunity to expand [length of stay].”
Bob Iger, CEO The Walt Disney Company, in the Q2 17 earnings call (May 9 2017)
Bob Iger noted about a year ago opportunities he saw to expand length of stay at the Walt Disney World hotels. One way to expand length of stay is through pricing mechanisms that reward longer stays.
Such a pricing mechanism can be as simple as giving a discount off of what would otherwise be a hotel’s rates in return for booking a stay of a certain length.
This is in effect what Universal does—it has its set of prices per night, but then takes a certain amount off of what would otherwise be the total if you book certain stay targets.
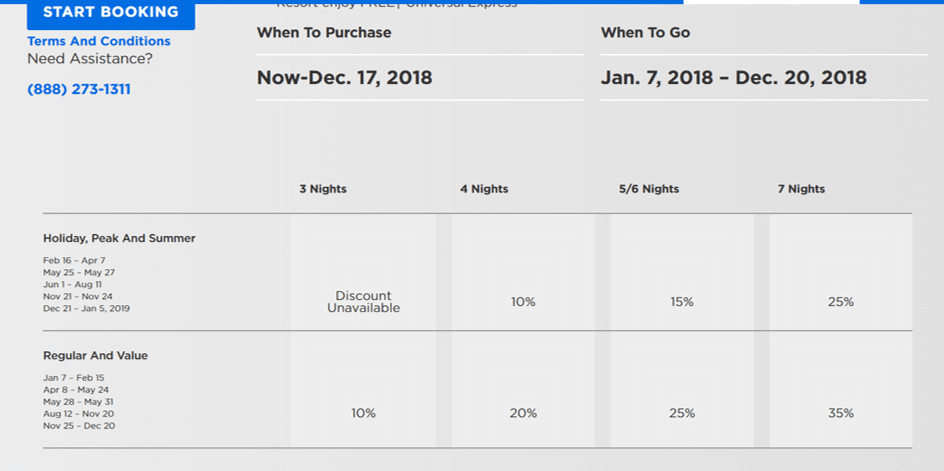
See the image—for example, on its far right, you’ll note that a seven night stay can be as much as 35% off what would otherwise be the sum of the nightly prices. That’s a big discount, in effect almost two and a half free nights (35% of seven nights= 2.45 nights).
Length of stay pricing can be meant to build a hotel’s occupancy—that is, add room nights—or to shift the current set of room nights to a group that has on average a longer length of stay.
If a hotel has plenty of rooms available and not many “typical” bookings already at the stay lengths at which the discounts kick in, then the goal would be to add room nights. High discounts might be accepted to do so, as little revenue would be lost from the few guests who already would have booked longer than the “typical” stay, and the new revenue from the extra nights would largely drop to the bottom line, since the variable costs of an extra night in a room are pretty low.
Length of stay pricing in already well-occupied hotels—as the Disney hotels are, recently reporting yet another quarter of occupancy in the 90% range—has a very different and more complicated dynamic.
Here you have different goals than increasing occupancy (because you have so little room to do so) and much less flexibility in discounting longer stays (because you are discounting many room nights that you could have sold at their regular rates).
The goal instead might be to convert the same number of room nights from shorter to longer stays, as longer stays are typically more profitable (as they spread the one-time costs of a single booking/check-in/check-out over more nights).
Or, if there is a value difference between shorter and longer stays not already captured in pricing, the goal might also be to use length of stay pricing to price shorter stays higher to extract more of the value they create. For example, Disney might be expecting Star Wars: Galaxy’s Edge, expected to open in the last quarter of 2019, to increase the demand for shorter stays from those guests coming to experience only it.
So if Disney were to institute length of stay pricing (as a typical practice, like Universal–not as a one-time deal), given high occupancies and already longer lengths of stay than Universal, I’d expect a couple of features to their program
- The deals to kick in after longer stays—for example, after five or six nights, not the three or four that Universal offers
- A lower discount curve—one that still begins at 10%, perhaps, but that doesn’t get nearly as high as 35%, other than as a temporary promotion that replaces other typical Disney World hotel deals
- A one-time price increase for the base set of undiscounted prices, so that revenue stays whole over most trip lengths.
This last point is the key one, so let me illustrate it with an example.
Let’s say Disney offers 10% off the total price of a room that would before the one-time price increase average $250 a night (in this example, thus a moderate), beginning with a six night stay.
To keep the same $1,500 revenue over the stay, average pre-discount prices would need to go up in a one-time price increase by 11% (the formula is 1/(1-discount percentage) – 1).* At a new price $278 a night, a 10% discount off the new total of $1,668 would yield the same initial $1,500 revenue.
In other words, when the hotels are essentially full and the goal is simply to lengthen average length of stay, you don’t want to give up revenue to do so—otherwise you simply lose money on the extensions.
Disney World usually announces its new hotel prices for the coming year in the summer, and while it varies across hotels, room types, and times of the year, prices commonly go up 4%+. If it used its summer 2018 pricing announcement to include for 2019 both typical price increases and also a one-time price increase meant to keep it whole after length of stay discounts, then in my example undiscounted prices would go up ~15%.
That’s a pretty big number—a headline grabbing number. How could Disney avoid some of those headlines? Well, one way to do it would be to institute a one-time price increase for something else related to the hotels, and use the revenue from it to offset the needed hotel room price increase. Like parking.
For median priced standard-view rooms, the new parking charge amounts to an average increase across 2018 (you get about the same results if you use just the last 7 or 8 months of 2018) of around 8% at the value resorts, 7% at the moderates, and 4.5% at the deluxes. So if half of guests pay for parking, then Disney World already has in hand price increases of 2.25 to 4%. It can use these already-existing one time increases to offset some of what it would otherwise want to do to 2019 prices, and perhaps (other than at the deluxes) even get the 2019 increase below 10%, which would help the headlines a bit…
Note that there are other ways to incent longer lengths of stay.
For example, since both shorter and longer Disney World stays tend to include weekends, Disney could make the price difference between weekends and weekdays even sharper than it already is.
For some time now, many, but not all, Disney World resorts have had higher prices on Friday and Saturday nights during many, but not all, price seasons.
And for the 2018 pricing year (released not long after Iger’s comments noted above) Disney also made Sunday and/or Thursday prices higher than the rest of its weekday prices at some resorts during some price seasons (gory details here).
Continuing this approach with even sharper differences between higher and lower priced nights would certainly either dis-incent and/or capture more value from shorter trips that include these higher priced nights. I’m not sure, though, that sharper differences would have much effect on lengthening stays, as—at least now—Disney does not inform you of the cost of adding a room night.
*The increase actually needs to be less than this, as those on shorter stays pay its full value. But for me to estimate how much less, I’d need data on the distribution of bookings by length of stay, which I don’t have, so I am ignoring this issue.
Follow yourfirstvisit.net on Facebook or Twitter or Pinterest!!
April 9, 2018 4 Comments
150 Different Rooms
“I’ve long said that Dave has the absolute best Disney resort room information I have found!” –Didi Marie, DIStherapy
In November, when I checked out of my Studio at Bay Lake Tower, I completed my 150th different stay in (and review of) a Disney World owned room, studio, villa, suite, cabin, or campsite.
Anyone can ride all the rides. But most who write about Disney World have not stayed in all the hotels–not even close. I’ve stayed in them all, and in every major room variant, multiple times–and recently.

This includes
- 30 value resort rooms and family suites, with Art of Animation and Pop Century in the lead with 8 and 10 stays respectively
- 35 rooms at the moderates, led by 10 stays at Port Orleans Riverside and 9 at Caribbean Beach
- 35 rooms at the deluxe resorts, led by 7 stays at the Contemporary and 5 at the Polynesian
- 46 different DVC studios and villas, led by Boulder Ridge Villas at the Wilderness Lodge and Kidani Village with 6 stays each
- Stays at 4 campsites at Fort Wilderness (my 5 stays in the Cabins are counted among the moderates.)

From my 2017 Pop Century stays.
In 2017 I stayed in (and published updated reviews of) twelve different Disney-owned rooms:
- Art of Animation
- Pop Century (twice)
- All-Star Sports
- Yacht Club (twice)
- Copper Creek Villas (twice)

From my 2017 Yacht Club stays.
(In 2017 I also stayed in and published updated reviews of two on-site but non-Disney resorts–Four Seasons Resort Orlando and The Disney World Dolphin. In 2016 I stayed in 17 different Disney World-owned rooms, and in 2015 14 Disney World-owned rooms and 6 non-Disney on-site rooms.)
This experience matters because universally the weakest part of most Disney World guidebooks and websites is their material on where to stay, and that weakness what I am trying to avoid.

From my 2017 Copper Creek stays.
One person staying repeatedly in all the rooms and in all their major variants (e.g. at Port Orleans Riverside not only standard rooms, but also five-person rooms, and Royal rooms) is the only way to develop a complete, consistent, up-to-date and accurate picture of the hotel options and their strong and weak points.
Reading and copying other people’s experiences just won’t cut it, and those whose approach depends on this routinely publish howlers and generally get too many facts or judgements wrong. I can think of one site (whose owner has very little actual Disney World experience) that claimed that Fort Wilderness is a monorail resort, and that the Contemporary is one of the least expensive deluxe resorts!

From my 2017 Caribbean Beach stay.
Even having your own team of reviewers doesn’t work well, as they can’t compare across their own direct experiences the way a single reviewer can, leading them to miss comparative floor plan nuances or even major differences. Careful readers of a well-known 840 page guidebook will discover that Port Orleans Riverside has trundle beds, that Pepper Market uses stamped tickets, and a dozen other claims that just haven’t been true for years–or were never true. (My guide book, while not perfect, is much better.)
Consistently good and up to date material on the Disney hotel options is sadly rare, because it takes major, multi-year commitments of time and money.
Luckily, I have been able to create the time, and you, because of your support of the book, your patronage of the site’s various sponsors (like Kelly B and The Official Ticket Center), and your interest in the ads on this site, create the money that in turn I spend trying to keep this hotel material great and up to date.
For links to my reviews of all the Disney World-owned hotels, see this.
Follow yourfirstvisit.net on Facebook or Twitter or Pinterest!!
December 24, 2017 2 Comments
How the Disney World Week Rankings are Built
I rank the weeks of the year for first time visitors to Disney World who might not be able to ever return to Disney World on this site—the 2017 Disney World week rankings are here, 2018 Disney World week rankings here, and draft 2019 Disney World week rankings are here.

(These same rankings also inform the guidebook I co-author with Josh of easyWDW.com, The easy Guide to Your Walt Disney World Visit.)
Here’s an example, for 2018:
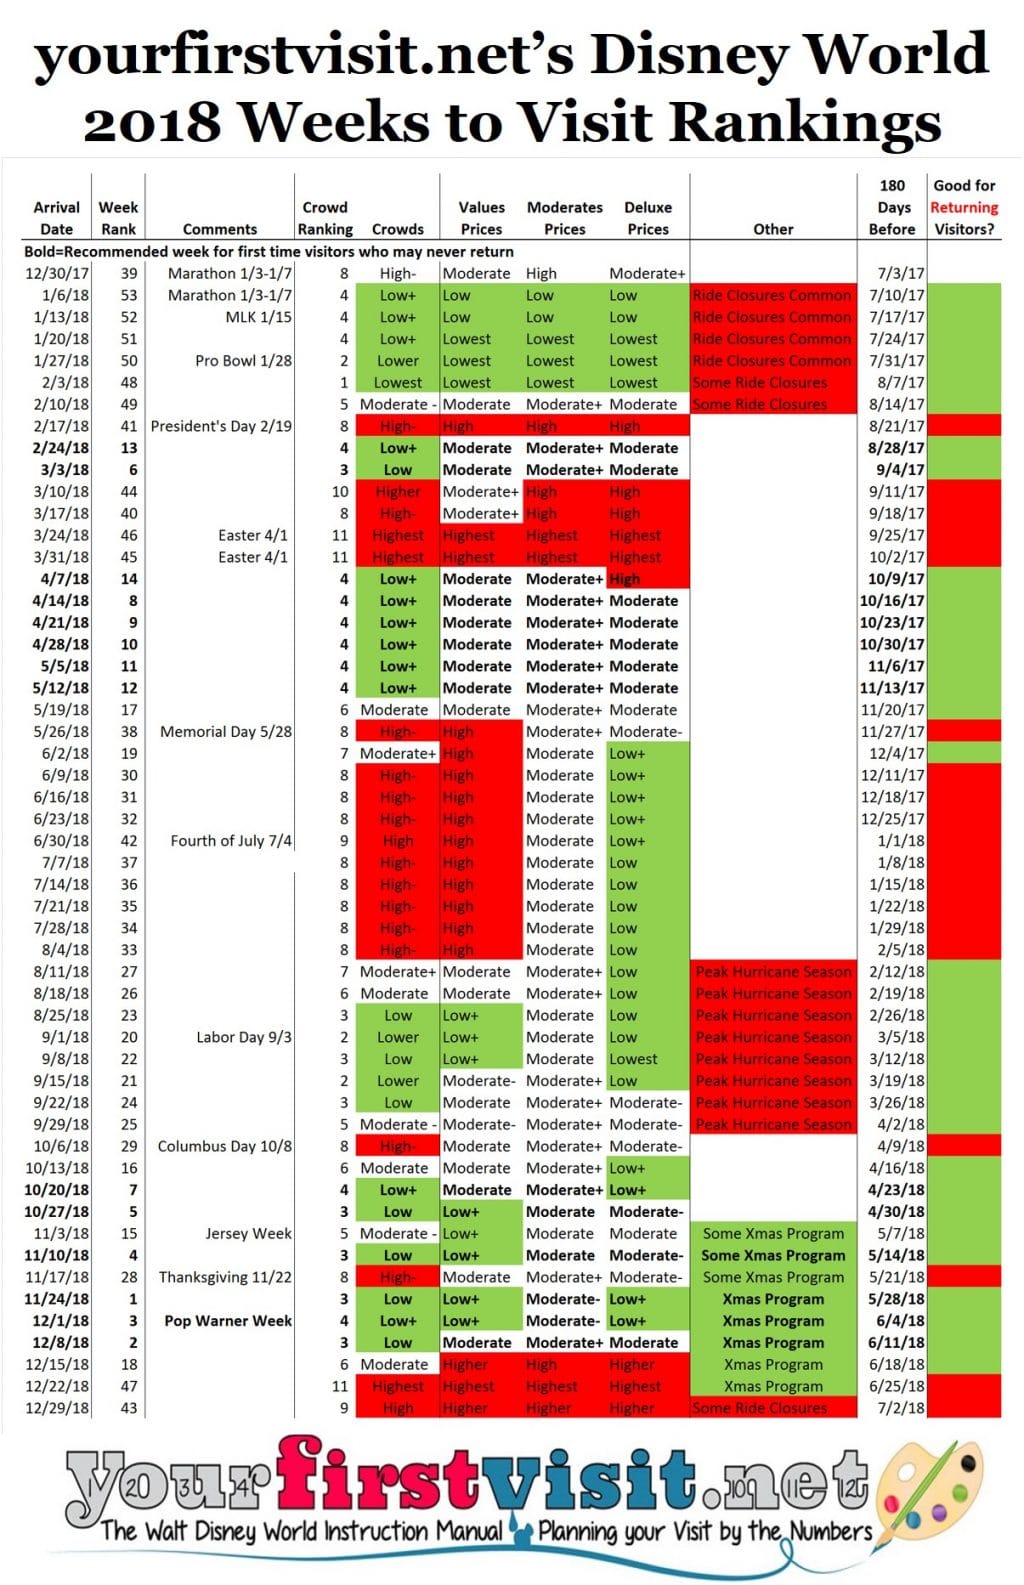
These rankings are meant to guide first timers who can never return towards better weeks, and away from bad weeks. They incorporate crowds and prices, as you might expect. But because they are meant for people who might be able to make only one visit, they also particularly downgrade the weeks of January and early February when rides are more commonly closed for refurb, and also view skeptically the weeks when the hurricane season is at its peak.
Both of these periods contain good weeks for returning visitors who might care less about these risks. So for this reason, I both include the crowd and price data in the chart, and also mark in green at the far right edge of the chart weeks that are good for returning visitors.
That way returning visitors can use the chart to pick their weeks, too—or they can simply focus on my crowd forecasts and price information. Disney World crowd forecasts for 2017 are here, 2018 here, and draft crowd forecasts for 2019 are here. Disney World resort pricing for 2017 is here, for 2018 is here, and draft price forecasts for 2019 are here.
Besides deprecating the ride closure and peak of the hurricane seasons, I also promote the lower-crowd part of the Christmas season, because it is such a magical time at Disney World.
So with that as the background, here’s the technical approach I take to ranking the weeks of the year for first time visitors.
HOW THE DISNEY WORLD WEEK RANKINGS ARE BUILT
First, I take the ride closure season weeks, and give them the lowest rankings of the year (because if you can only come once, why come at a time when some great rides predictably will be closed?)
In every grouping, including these weeks, higher crowd weeks get the worst ranking, and within equivalent crowd rankings, higher prices break the ties. This involves a bit of judgment, as the deluxes work to a different price seasons than the other resorts from July into the fall, and the moderates don’t show as much price variation over the year as the other price classes do. So if you are committed to a certain resort type, note also the price levels of your resort type among these weeks.
Next to be ranked are all the remaining higher crowd weeks, with the worst rankings going to the highest crowds, and ties sorted by prices.
Next to be ranked is the remaining weeks in the peak of the hurricane season. I have taken a lot of grief over the years for deprecating these weeks, as, like the January and early February weeks, they include a number of lower crowd and lower price dates:
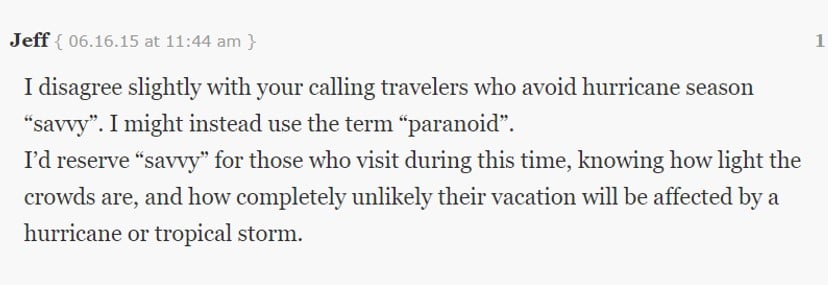
After the past two years, however, I expect people to hold off a bit on the “hurricanes never affect Disney World” claim…
This leaves a group of moderate and lower crowd weeks of various prices that are in neither the ride closure season nor the peak of the hurricane season. The moderate crowd weeks get ranked by crowds then prices, in the usual fashion.
Then the remaining low crowd weeks get ranked the same way, with the expectation that the Christmas season low crowd weeks get privileged rankings. This set of weeks become my “Recommended Weeks”—usually 13 to 15 a year. (The number has narrowed over time as October has gotten more crowded; in any given year, an early Thanksgiving might add a fourth December week, and an early Easter might add an extra April week.)
The rankings are fundamentally based on crowd forecasts and actual or forecast prices.
The crowd forecasts are based on my actual experience—I’m in the parks 30-60 days a year over six to ten visits.
For example, in 2017:
- I’ll be going November for the Christmas Party and to see the Yacht Club refurb. (That Yacht Club room, incidentally, will be the 150th different Disney World-owned room, studio, villa, suite, cabin or campsite I’ve stayed in. So I’m pretty reliable on the Disney World hotels, too…)
- I went in September for the Halloween Party, the new film at Mission: SPACE, and the new Fantasmic dessert thingy
- I went in July for the new Copper Creek Villas and the rest of the new stuff at the Wilderness Lodge, the Pop Century room refurb, and the new Happily Ever After dessert party
- I went in June for Flight of Passage, Na’vi River Journey, and the Caribbean Beach refurb
- I went in May for the new Magic Kingdom evening show Happily Ever After
- I went in February for the new Animal Kingdom evening show Rivers of Light
- I went in January for the Pro Bowl events at Disney World (and still haven’t written about them…) but did also see again the Disney After Hours event, and covered the new Festival of The Arts and the refurbed rooms at the Dolphin and Kidani Village.
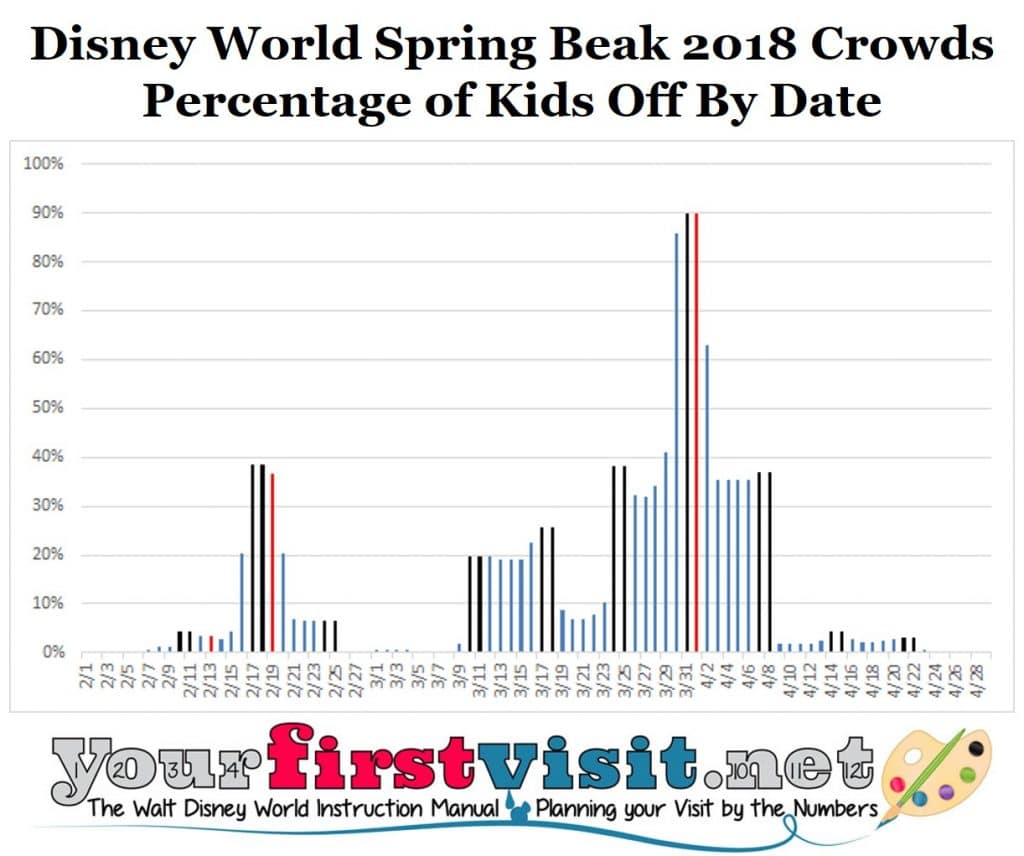
This experience is supplemented by extensive analysis of school breaks—here’s an example from my analysis of spring breaks in 2018:
The prices are based on actuals for 2017 and 2018, and on forecasts based on recent Disney practice for 2019. I’ll be revising the 2019 rankings as necessary after the actual 2019 prices come out, likely in the summer of 2018, and based on a full analysis of 2018-2019 school year breaks, also in the summer of 2018 (too many districts don’t publish their calendars for the upcoming school year until May or June for me to do this earlier).
So that’s how the week rankings are built!
Follow yourfirstvisit.net on Facebook or Twitter or Pinterest!!
October 9, 2017 3 Comments
Testimonials and Puffery
Since it opened, this site has helped more than 10 million people. Among the reactions:
- “This site is astonishingly helpful…Highly recommended!” –Lee Cockerell, Former Executive Vice President, Operations, Walt Disney World® Resort, and author of Creating Magic
- “Great site! Keep up the good work!”–Len Testa, co-author of The Unofficial Guide to Walt Disney World 2017
- “Insightful, no-nonsense advice for both novice and repeat visitors!” –Julie Neal, author of The Complete Walt Disney World 2017

- “The premier website for first time visitors to Walt Disney World!” –Steve Bell, webmaster, MilitaryDisneyTips.com
- “The most valuable Disney World site on the web!”—Lee
- “This website is a staggering achievement!” —Jeff
- “The best Disney website that I’ve ever found!” – Brie
- “This site is amazing!!!… there is nothing else like it! Great job!” –Fiona
- “This site ROCKS! Thanks thanks thanks for the great advice!” —Eva
- “Brilliant website! The most informative website I’ve seen on Disney!” –Chris
- “If it weren’t for this site, I think we really would have messed this trip up!” —Mary Beth
- “The bestest blogger ever!” –Sara M
- ”Your site is brilliant! I’ve used you for the last three years to plan our holiday. You’ve become part of the process, nothing happens until I’ve checked out your site!” —Alicia
- “I go to WDW about once a year, know the parks like the back of my hand, and have a system for planning our trips. Even so, there’s a LOT of useful info on here, even for me. AWESOME site! Thanks!”—Debra
- “I’ve been going to WDW with the kids for over 15 years now and still found this site helpful! Great, I repeat great site!” — Carolyn
- “I’ve been to Disney World every year for almost 20 years and have always done it a certain way. Your suggestions were eye-opening. After a flawless vacation, I will be “doing it your way” from now on! Many thanks!!” –Brandon
- “I’ve been to Disney World over 40 times and I still find tons of great tips and information from your site! This is a must-stop web site for anyone heading to Mouseville! Nice job and thank you!” –Adam
- “OMG! LOVE your site. I have been going to Disney since I was 9, and I even did the Disney College Program and thought I knew Disney, but I have learned SO much from your site!” –Kimberley
- “This site is a miracle!” —Carol
- “Dave, I love, love, love your site! I can’t tell you how much it has helped my family plan our Disney World vacations. You are a God in the blogging world for WDW.” —Alex
- “You are the Disney Buddha!” –Carol
- “I swear you are the Disney Angel. Thank you oh so much!” –Sami
- ”You are the Yoda of Disney!” —Stefanie
- “Thanks for being a Disney Mastermind!” —Jennifer
- “Thanks! Around our house, you are known as ‘Dave the guru.’” —Wendy
- “Dave, you have earned a galaxy of stars in your crown in Heaven for helping so many people have a great time at Disney World!” – Ted
- “I wish I had found this site last January. It would have saved me so much time. You really are the best. Ever think of running for President?” —Patricia
- “This is an INSANE site! THANK YOU!” –Emily
- “This is a must-go, must-read site!!” —klmall
- “Your ideas are genius! Unbelievably helpful!” —Tara
- “This site is TERRIFIC! We’d been to Disney World a few times before, but our latest trip was light years better because of your wonderful advice! Using your recommendations, we had much smoother days, experienced far lower crowds, and had a much more enjoyable time. I’m recommending your site to everyone I know!” –Katie
- ”I’ve been going to Disney World every year, and thought I had a pretty good plan, but we just re-planned our entire trip thanks to this site. We added 6 people to our usual group, but still we saved $1,600 and found a less crowded time!! Thanks Dave for this great, unbiased site!” –Steve
- “Thank you so much for your fabulous website! We almost completely planned the trip based on your site, and our trip was amazing and everything flowed so well!” –Michelle
- “This is awesome! Where was this site when I had to figure all this out for myself?” —Cindi R
- “WOW – I am SO impressed with your fact based approach to Disney – so awesome and refreshing.” – Danielle
- “As a four-time Disney veteran, this website is awesome! I wish it had been around ten years ago for our first trip!” —Chris P
- “Having done the trip 6 times, I really wish the site had been around when we started! What a great idea!” —Joan S
- “I think you should re-name your site ‘(notjustfor) yourfirstvisit.net.’!
I am a frequent visitor to the “happiest place on earth”, and have become very knowledgeable about planning, visiting, eating, avoiding crowds and lines, how to use EMHs to our advantage, etc, and know the parks like my own neighborhood.
Nevertheless, I am finding so much information here that is helpful even to a seasoned guest like myself, especially the detailed info regarding best and worst weeks to visit. LOVE your rankings, all the great advice, and the links to extra info.” —Gramma Kaye
- “Great, right-to-it information, very quick to access. ” —JuneChickie
- “Dave, what a great site! I love how quickly and easily you can get to the information you need!”—crazycatlady
- “Dave, your site is so to the point! I love it!” —momma2minnie
- “Great site! I love the easy-to-follow plans. ” —Kailua’s Belle
- “Short, sweet, and to the point. Love the charts too!” —katepass72
- “This site is a one-click shot! It’s all figured out…a great help!” —Jen
- “As a Disney Travel Specialist, I have assisted thousands of guests with their Disney trips. First time guests are very often overwhelmed with planning their vacations to Disney. Your site is a great source of straight to the point information which will be helpful to many!” —Kerri G.
- “Dave you have done a wonderful job…thank you for sharing all this great information! ” —Damien2213
- “Dave—your site is wonderful, I only wish I found it sooner!” —brooklynbrenden
- “Wow, Dave! What a great site! Now I have a great site to send to people who ask about what to see and do their first trip!” —momimouse27
- ”The information you provided is priceless; a simple thanks does not do any justice; I have to find a new way/ word to thank you. You are really awesome!” —Mahe
- “I’ve been to WDW 55 times, but still found this site so helpful!” –Kerm
- “This site is by far the best I have ever run across regarding Disney!!” –Kim
- “The best Disney site on the web!” –Lisa
- “By far the most informative and best WDW website for ALL visitors!” —Mark
- “I’ve been looking at Disney World sites for years, and this is the best I’ve ever seen for planning a Disney vacation!” —Alicia
Follow yourfirstvisit.net on Facebook or Twitter or Pinterest!!
January 8, 2017 No Comments