
Category — zz. Even Geekier than Usual
How the Disney World Week Rankings are Built
I rank the weeks of the year for first time visitors to Disney World who might not be able to ever return to Disney World on this site—the 2017 Disney World week rankings are here, 2018 Disney World week rankings here, and draft 2019 Disney World week rankings are here.

(These same rankings also inform the guidebook I co-author with Josh of easyWDW.com, The easy Guide to Your Walt Disney World Visit.)
Here’s an example, for 2018:
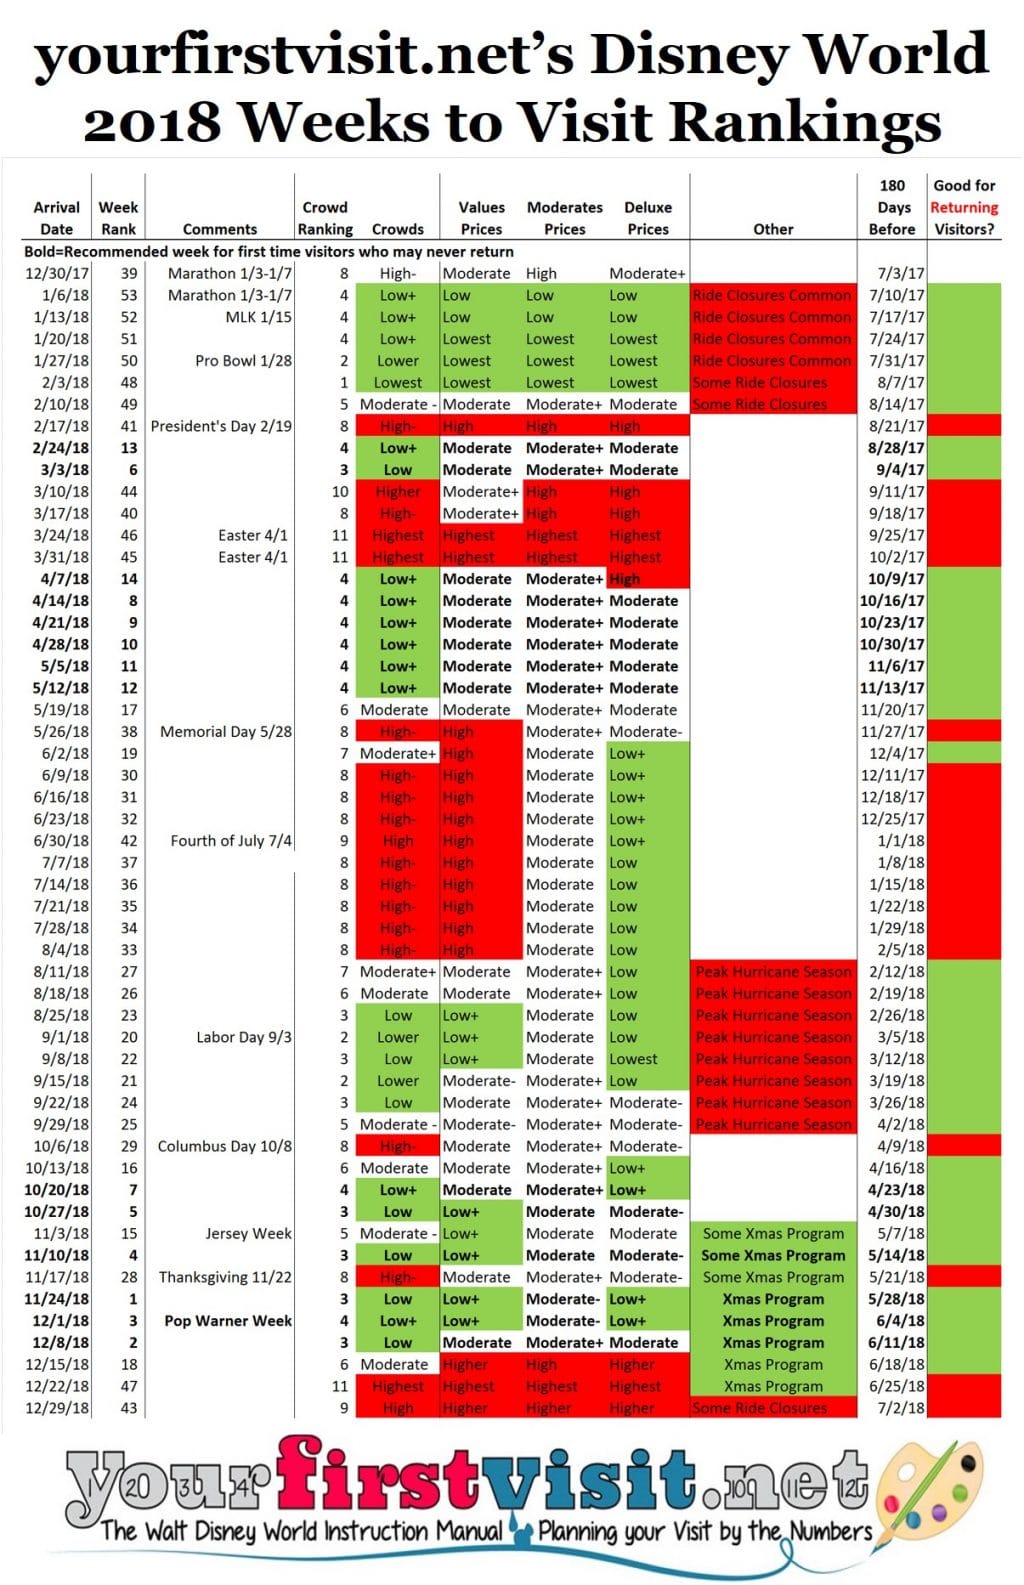
These rankings are meant to guide first timers who can never return towards better weeks, and away from bad weeks. They incorporate crowds and prices, as you might expect. But because they are meant for people who might be able to make only one visit, they also particularly downgrade the weeks of January and early February when rides are more commonly closed for refurb, and also view skeptically the weeks when the hurricane season is at its peak.
Both of these periods contain good weeks for returning visitors who might care less about these risks. So for this reason, I both include the crowd and price data in the chart, and also mark in green at the far right edge of the chart weeks that are good for returning visitors.
That way returning visitors can use the chart to pick their weeks, too—or they can simply focus on my crowd forecasts and price information. Disney World crowd forecasts for 2017 are here, 2018 here, and draft crowd forecasts for 2019 are here. Disney World resort pricing for 2017 is here, for 2018 is here, and draft price forecasts for 2019 are here.
Besides deprecating the ride closure and peak of the hurricane seasons, I also promote the lower-crowd part of the Christmas season, because it is such a magical time at Disney World.
So with that as the background, here’s the technical approach I take to ranking the weeks of the year for first time visitors.
HOW THE DISNEY WORLD WEEK RANKINGS ARE BUILT
First, I take the ride closure season weeks, and give them the lowest rankings of the year (because if you can only come once, why come at a time when some great rides predictably will be closed?)
In every grouping, including these weeks, higher crowd weeks get the worst ranking, and within equivalent crowd rankings, higher prices break the ties. This involves a bit of judgment, as the deluxes work to a different price seasons than the other resorts from July into the fall, and the moderates don’t show as much price variation over the year as the other price classes do. So if you are committed to a certain resort type, note also the price levels of your resort type among these weeks.
Next to be ranked are all the remaining higher crowd weeks, with the worst rankings going to the highest crowds, and ties sorted by prices.
Next to be ranked is the remaining weeks in the peak of the hurricane season. I have taken a lot of grief over the years for deprecating these weeks, as, like the January and early February weeks, they include a number of lower crowd and lower price dates:
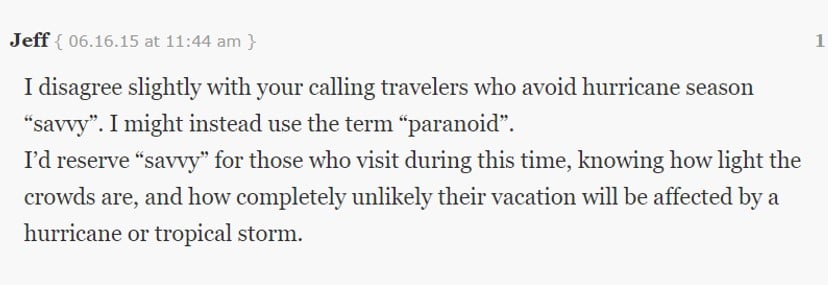
After the past two years, however, I expect people to hold off a bit on the “hurricanes never affect Disney World” claim…
This leaves a group of moderate and lower crowd weeks of various prices that are in neither the ride closure season nor the peak of the hurricane season. The moderate crowd weeks get ranked by crowds then prices, in the usual fashion.
Then the remaining low crowd weeks get ranked the same way, with the expectation that the Christmas season low crowd weeks get privileged rankings. This set of weeks become my “Recommended Weeks”—usually 13 to 15 a year. (The number has narrowed over time as October has gotten more crowded; in any given year, an early Thanksgiving might add a fourth December week, and an early Easter might add an extra April week.)
The rankings are fundamentally based on crowd forecasts and actual or forecast prices.
The crowd forecasts are based on my actual experience—I’m in the parks 30-60 days a year over six to ten visits.
For example, in 2017:
- I’ll be going November for the Christmas Party and to see the Yacht Club refurb. (That Yacht Club room, incidentally, will be the 150th different Disney World-owned room, studio, villa, suite, cabin or campsite I’ve stayed in. So I’m pretty reliable on the Disney World hotels, too…)
- I went in September for the Halloween Party, the new film at Mission: SPACE, and the new Fantasmic dessert thingy
- I went in July for the new Copper Creek Villas and the rest of the new stuff at the Wilderness Lodge, the Pop Century room refurb, and the new Happily Ever After dessert party
- I went in June for Flight of Passage, Na’vi River Journey, and the Caribbean Beach refurb
- I went in May for the new Magic Kingdom evening show Happily Ever After
- I went in February for the new Animal Kingdom evening show Rivers of Light
- I went in January for the Pro Bowl events at Disney World (and still haven’t written about them…) but did also see again the Disney After Hours event, and covered the new Festival of The Arts and the refurbed rooms at the Dolphin and Kidani Village.
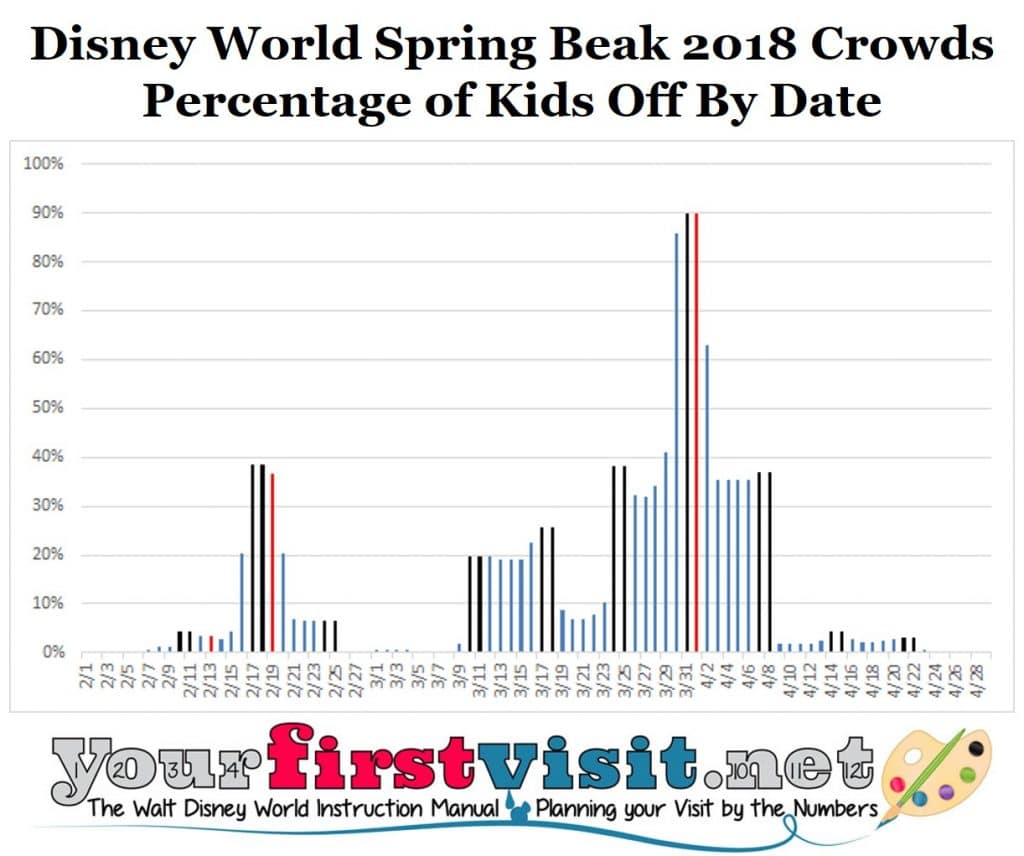
This experience is supplemented by extensive analysis of school breaks—here’s an example from my analysis of spring breaks in 2018:
The prices are based on actuals for 2017 and 2018, and on forecasts based on recent Disney practice for 2019. I’ll be revising the 2019 rankings as necessary after the actual 2019 prices come out, likely in the summer of 2018, and based on a full analysis of 2018-2019 school year breaks, also in the summer of 2018 (too many districts don’t publish their calendars for the upcoming school year until May or June for me to do this earlier).
So that’s how the week rankings are built!


Follow yourfirstvisit.net on Facebook or Twitter or Pinterest!!
October 9, 2017 3 Comments
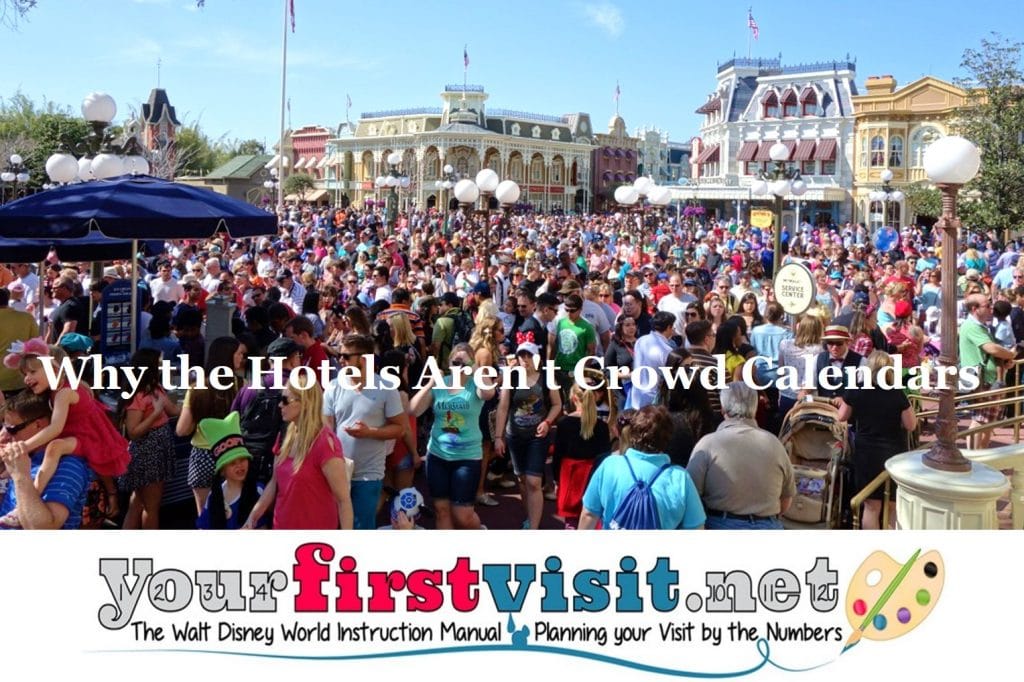
Why The Hotels Aren’t Crowd Calendars
Every year around this time I get comments from people trying to book one of my recommended December weeks that say something like “all the Disney World hotels are booked, so how can these be lower-crowd weeks?”
The short answer I always give is that this happens every year.
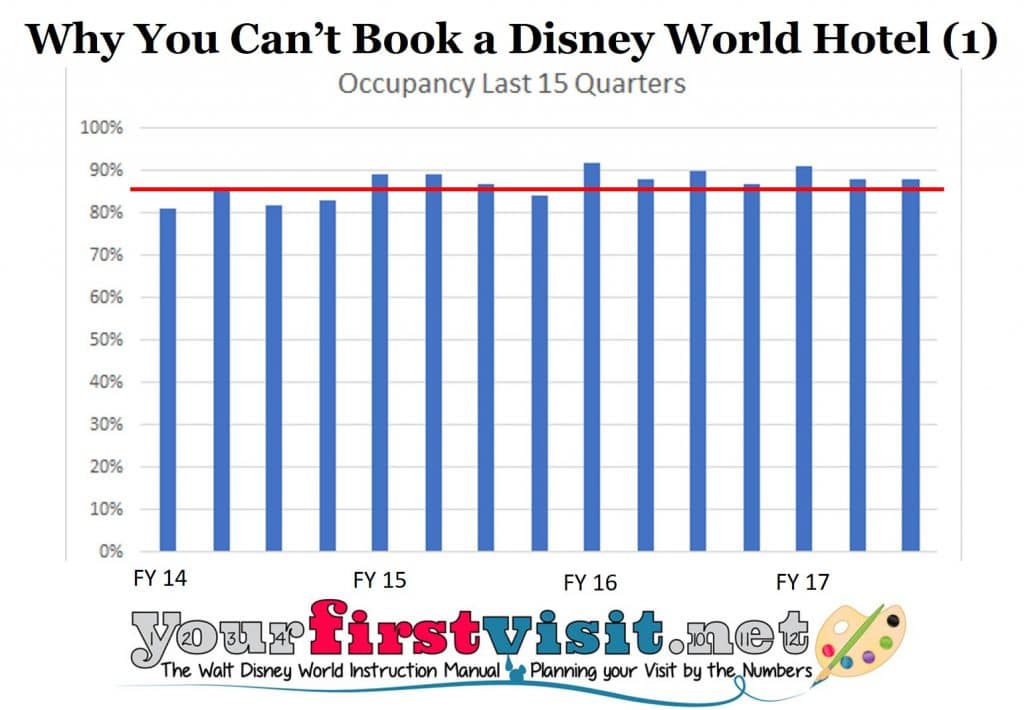
Disney World hotel occupancy is not a crowd calendar. These hotels are almost full almost all of the time, in high crowd periods or low. For three years now, occupancy has been above 85 percent, and for the last seven quarters it’s averaged 89 percent. For an average room, that equates to about two nights free every three weeks.
Rooms have been even harder to find in 2017.
- First, about 3 percent of capacity permanently disappeared in 2017, with demolition of rooms at Caribbean Beach and Coronado Springs, and conversion of formerly eight-person areas at the Wilderness Lodge to four-person areas in Copper Creek.
- Second, the ongoing room refurbs at Pop Century and Coronado Springs have taken another 1.5% to 3% of rooms out of capacity, depending on how many buildings are closed at a time for refurb
This may not sound like a lot–but it’s about half of the previous excess capacity. So a room that used to be unused two nights out of every three weeks now might now be unused two nights out of every six weeks…
You can tell from Disney’s pricing patterns that the most popular nights are Fridays and Saturdays, and the least popular Mondays, Tuesdays and Wednesdays. So vacations that include weekend nights–as almost all do–are even harder to book.
Moreover, I am told–I can’t independently confirm this–that Disney is booking “orphan” room nights differently.
Say a room is booked through a Saturday, then available the next five nights Sunday to Thursday, and then booked again beginning the Friday after. Before this purported change, a guest who wanted to book this room Monday, Tuesday and Wednesday would have no problem, even though it would leave “orphan,” hard-to-book single nights on Sunday and Thursday.
Word is that this no longer works so well, as Disney’s systems prefer in this case guests looking for a Sunday-Tuesday or Tuesday-Thursday stay, leaving a more bookable two-night block before or after.
So guests looking for longer stays will run into the problem of all the weekend nights being booked up, and guests looking for shorter stays will have easier or harder times depending on how many orphan nights their preferred dates will yield. On shorter stays, shifting your check-in day just a day can help. On longer stays, dividing them into two or even three shorter stays can help.
The best approach, though, is to book well in advance. Historically, people have most commonly booked their Disney World vacations three months ahead. The more ahead of this you can book your rooms, the better off you will be. More than 180 days before is the magic number…but even if it’s closer than that, as soon as possible is better than later!
Another way to ease the burden is to use a travel agent, who likely will have both more patience and more ideas for finding you a room. This site has partnered for years with Kelly, who you can reach at [email protected] or 980-429-4499.
Quarter to quarter, Disney’s recent average occupancy* has been between 85 and 90% for a while (the red line is 85%):
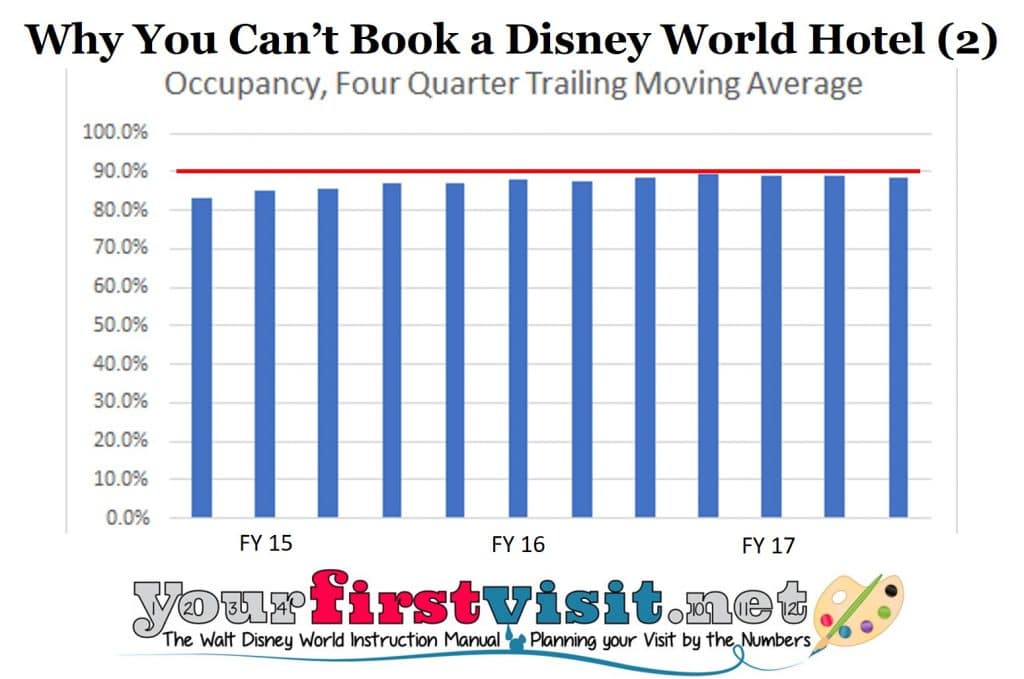
On a four-quarter trailing moving average basis (which cleans out the effects of seasonality), it’s been around 90% for seven quarters in a row (red line is 90% occupancy):
The difference between 85% and 95% occupancy is about 2,540 more rooms filled per night—or, at an average of 3 people per room, about 8,000 more people.
Eight thousand more people divided among four theme parks, two water parks, Universal, Sea World, Disney Springs, days off, etc. just don’t much matter to a set of theme parks that have a base average of more than 147,000 visitors a day anyway.
(This is the same reason that the cheering competitions, runDisney events, etc., don’t much matter to park crowding. Fifteen thousand cheerleaders or runners and family members may seem like a lot to you…but translate into less than 10 percent more people on property.)
Here’s the longer answer.
WHY THE DISNEY HOTELS ARE NOT A CROWD CALENDAR
Crowds at Disney World don’t come from the Disney hotels, which are almost always close to full. They come from hotels outside the parks.
On an average day in 2016, there were 147,000 people in one of the four Disney World theme parks. (Math applied to this.) You can convert those into required hotel rooms by making assumptions about
- People per room (e.g. 3) and
- Rooms occupied by those not in a Disney theme park that day: people in a hotel room for a Disney World vacation but taking a day off from the four Disney theme parks and instead going to a water park, Disney Springs, Universal, taking a day at the pool, shopping, or skipping the parks on their arrival night)—I’ll use 25% as my assumption on this.
So divide the 147,000 people in the parks on an average day by three people per room and you get 49,000 required rooms; shift this by another 25% for the folk on a Disney-oriented vacation but not in a Disney park that day and you get 65,000 required rooms.
Disney World itself right now has “only” about 25,400 rooms available, and probably can’t hit much above 95% occupancy for any sustained period (at 95% occupancy rooms are booked 19 out of every 20 nights) except in the rarest of circumstances, because even with the new orphan night policy, there aren’t enough two and one-night stays to fill in the tiny gaps that exist between 95% and 100% occupancy.
At 90% occupancy Disney World can serve just 22,900 of the 65,000 needed rooms—just a little more than a third.
Occupancy at the Disney hotels doesn’t flex up and down much with crowds. Rather, Disney runs its price seasons and its deals to hit a fairly high level of average occupancy year round. Hotels fill up in the highest-crowd times, but they also fill up during the rest of the year too–including times when savvy Disney World visitors (the most likely to occupy a Disney space—especially DVC owners) know are great times to visit—like early December!!
In other words, the crowds don’t come from Disney World hotels. They just don’t flex enough. Rather, they come from off-property folk. So full Disney World hotels don’t necessarily mean high crowds. (They can mean that—it’s just that they don’t necessarily do so.)
Want a real crowd calendar? See this.
*This is Disney’s domestic occupancy, so it does include the three Anaheim hotels, which make up about 10% of total rooms. Because it’s just 10%, I ignore them, except that I do substract them to get rooms available in Florida.
Follow yourfirstvisit.net on Facebook or Twitter or Pinterest!!
October 8, 2017 9 Comments
End of Summer 2017 Crowds at Walt Disney World
This site’s Disney World crowd calendars always show crowds dropping off in later August.
For example, in 2017, crowd rankings go from 8/high-minus at the end of July/beginning of August down to 2/lower in early September.
This page both explain how that comes about and also reviews how the site’s crowd calendars are built.
END OF SUMMER 2017 CROWDS AT WALT DISNEY WORLD
The highest-crowd periods at Walt Disney World all have one thing in common: they are convenient times for parents to take their kids to Orlando. That is, they are times that kids are out of school and that parents traditionally can take off of work.
What’s not so clear until you do the numbers is that actual school vacation dates are much more varied than you’d think. And there’s no good source you can go to that explains what all these varied dates are.
So usually every year about this time one of my nieces goes to more hundreds of school district websites and captures all the key vacation dates for the upcoming academic year. This year all of my nieces are distracted by babies, so I did half this data collection myself.
(This time of year because you’d be surprised many districts don’t put their calendars up for the upcoming year until June, even late June–looking at you, Michigan.)
This year I collected data on 280 school districts with 15.3 million kids–about a third of the US school-age population. These include the 100 largest school districts in the U.S., plus 180 more of the next largest school districts mostly in the more highly-populated states east of the Mississippi–that is, the states from which in particular Walt Disney World draws its visitors.
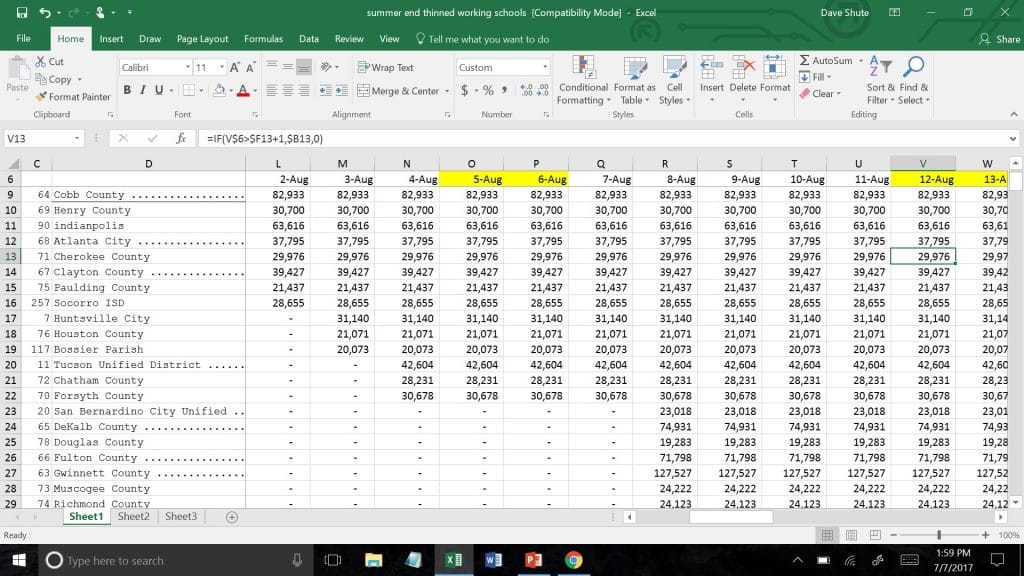
I then create a database that shows based on district enrollment every kid who is off on every date, and weight each district based on that district’s state’s proportion of total US visits to this website (because Disney won’t tell me actual visitation by state!). See the image above for a screenshot example.
Finally, I calculate percentage of total weighted kids on break by date and use that to inform the crowd calendars.
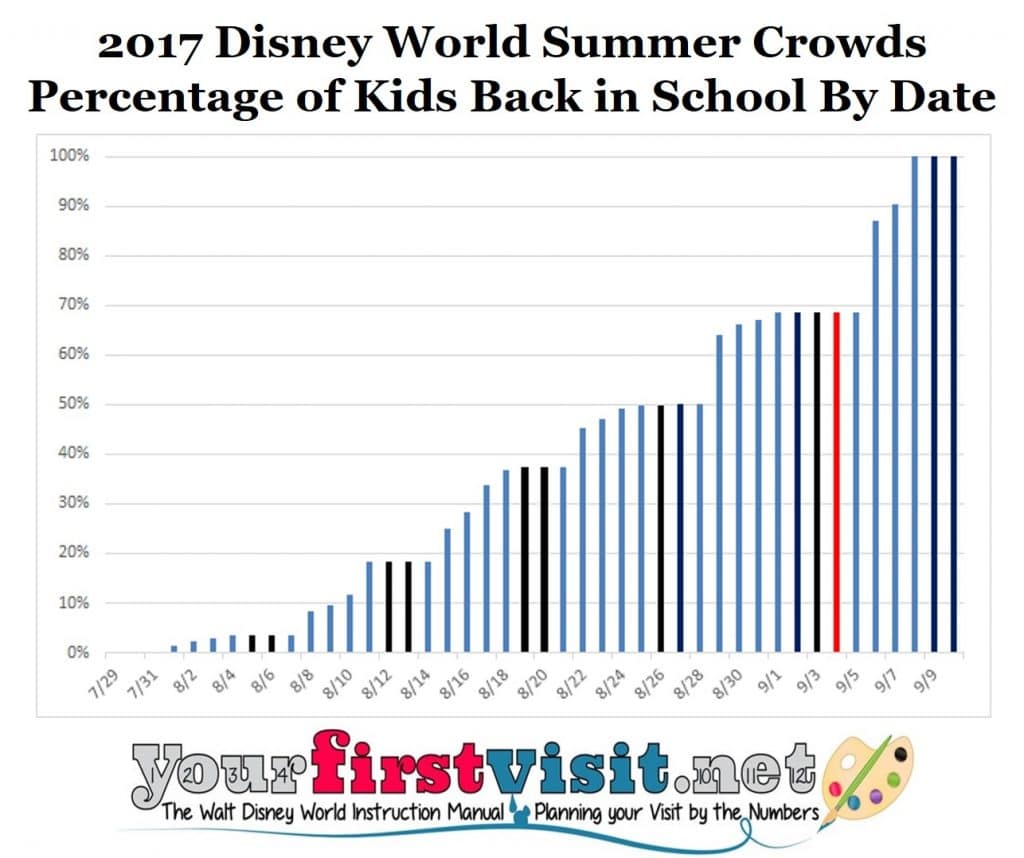 Above are the results of this for when kids go back to school in 2017.
So you can see that
- Kids don’t start going back to school in real numbers until Tuesday 8/8
- More than a third are back in school by 8/17
- About half are back in school by Friday 8/25 and
- Almost 70% are back in school before Labor Day (noted in red)
In 2017, pretty much all kids are back in school by the Friday after Labor Day.
Moreover, vacation patterns typically don’t have people returning from their vacation the night before school begins, so the effect of these back-to-school dates is offset into earlier August by around a week.
Thus, in the 2017 crowd calendar, the week of 7/29 is rated 8/high-minus crowds, the week of 8/5 7/moderate-plus crowds, the week of 8/12 6/moderate crowds, the week of 8/19 4/low-plus crowds, and the week of 8/26 3/low crowds.

Follow yourfirstvisit.net on Facebook or Twitter or Pinterest!!
July 9, 2017 No Comments
Disney World Resort Price Changes for 2018
Disney World’s 2018 resort hotel prices were released on June 20.
You can book them by contacting Kelly B at [email protected] or 980-429-4499.

The prices that came out June 20 were a bit of a mess, particularly for January 2018, and have changed several times since–see the Art of Animation example (click it to enlarge it):
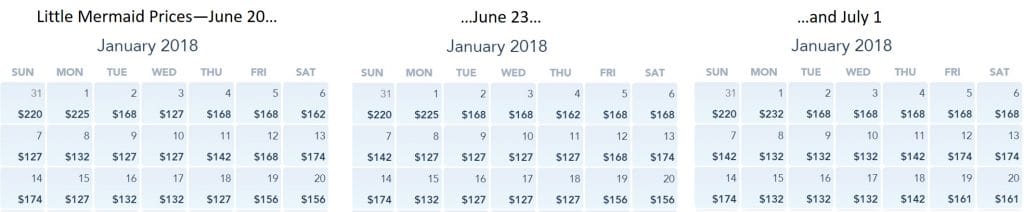
They seem to have stabilized, however, so I’ve been analyzing a sample of resorts, and the upshot is that compared to the quite restrained price increases we saw in 2017, prices are up substantially in most–though not all–resorts in 2018.
Only Caribbean Beach and Grand Floridian see very small price increases for 2018. 2018 Value resort prices are up 6-9%; 2018 moderate resort prices (except Caribbean Beach) are up 5-7%; and 2018 deluxe prices (except for Grand Floridian) are up 5-7%.
(Reviews of all Disney World resort hotels mentioned in this pricing round-up are linked to from here–I’ve stayed in more than 140 different Disney World hotel rooms, and my reviews are based on these stays.)
The other thing that’s new for 2018 is more distinctions among day prices in the same price seasons. For many (but not all) major seasons, you’ll see new Thursday prices, and in the moderates and values some new Sunday prices as well.
Analyzing Disney resort price changes is difficult—there’s more than 20 hotels, many differently-priced room and view types within them, seven to nine different major price seasons over the course of the year, additional weekend and holiday upcharges, and more. As a result, unless you have a LOT of time on your hands you need to sample, and that’s what I’ve done.
In general, I gather daily price data on the lowest and next-highest priced rooms at all of the resorts (and from more room/price combos if a resort looks odd, as Caribbean Beach and Grand Floridian do in 2018), and then analyze:
- Season price increases across all the major Disney World price seasons—e.g. “Regular” season prices for 2018 compared to 2017
- Changes in the dates covered by price seasons that have an impact on price levels—only a bit of that happened for 2018
- Changes in the relative price levels of hotels in a single price class—2018 saw little change here.
For 2018 I sampled 40 room types across the seven major price seasons at the values and moderates and the nine major price seasons at the deluxes. This yielded more than 500 points of comparison between 2018 and 2017 prices.
In what follows, when I talk about price changes for the entire year I mean seasonally-weighted price changes (that is, weighted based on the percentage of 2018 days in each major price season–there’s seven major seasons at the values and moderates, and nine at the deluxes), and when I talk about a specific price season increase I am comparing average Sunday night to Saturday night prices across the two years, to account for the different prices on different days problem. So yes, it is some spooky genius math shit.
The detailed results follow.
DISNEY WORLD VALUE RESORTS PRICING IN 2018
Price season structure changes
2018 largely maintains the recent 2017 seasonal structure at the values, although with the day changes noted below. One minor twist is the addition of a few days of Regular season in February (beginning 2/11/18) that were Value season in 2017. (This is a reversion to a pattern we first saw in 2016.)

For those who were not paying attention, several years ago Disney introduced the “Fall” price season, which replaced what used to be Value season dates in late November and early December. In 2016, Disney implemented more seasonal changes at the values and moderates, in effect raising prices by moving various dates from lower to higher-priced seasons. Value 2 dates in later August and early September shifted to Fall, and Fall in later September to almost the end of October was shifted to Regular.
Up until 2018, rooms typically had one or two prices during a season. If two, there was one price for Sunday-Thursday and another for Friday and Saturday.
2018 sees more variety in daily prices during the Value, Regular, Fall and Peak seasons. The typical pattern is now Price A Sunday, Price B Monday-Wednesday, Price A again Thursday, and Price C on Fridays and Saturdays.
Here’s an example from Art of Animation during the 2018 Value season:
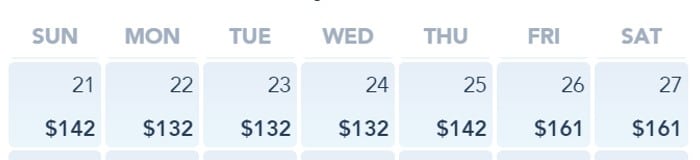
The effect of this is to make long weekend stays more expensive, and Monday-Wednesday stays less expensive, than would otherwise be the case. This is a somewhat mechanical start (mechanical because at the values, the difference between Price A and Price B is typically a flat $10 across resorts and seasons) to a set of prices that more fully reflect differences in demand by night.
Finally, the much earlier Easter in 2018 means that many more days in March-April will be regular season, and that many less Peak or Easter seasons, than in 2017. The difference is about two weeks more worth of Regular season prices, mostly in April.
Price level changes
The basic pattern among value resort standard rooms of Art of Animation Little Mermaid rooms being most expensive and the All-Stars being least expensive continues in 2018.
Pop Century rooms see the highest increases for 2018, bringing them a bit closer to the Little Mermaid rooms, but prices in the other value resorts go up quite a bit as well. Little Mermaid rooms remain shockingly close to standard moderate room prices some dates (especially in the Summer season in 2018, where a week in a Little Mermaid room averages $223 a night and a week in Caribbean Beach, which sees no material 2018 price increases until its Fall season, $234 a night).
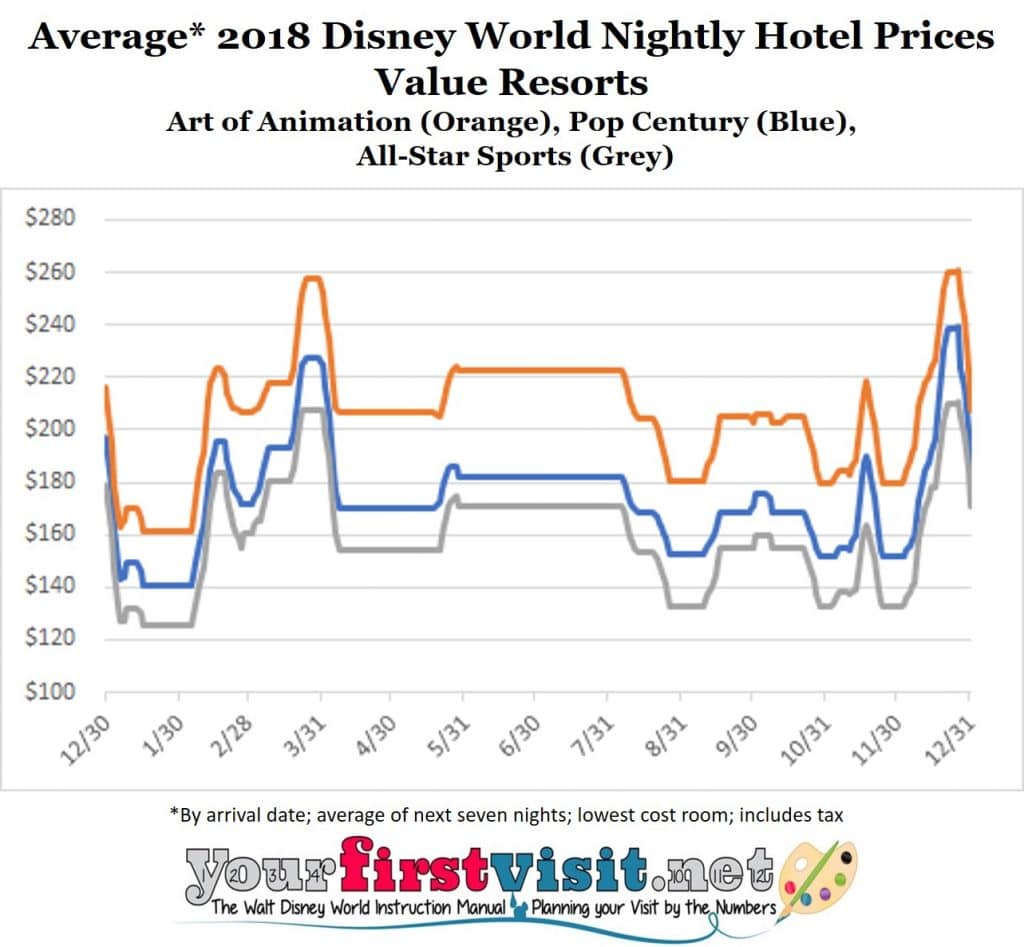
On average across 2018, Little Mermaid rooms are ~$30 more expensive per night than Pop Century and ~$45 more per night than the All-Stars. These differences are shown for standard rooms across the prices seasons in the chart.
Family Suite options at the values also continue their basic price structure. The suites at All-Star Music are the least expensive, The Cars and Lion King suites at Art of Animation are at a much higher level–averaging $100 more a night than those at Music—and the Finding Nemo suites at Art of Animation remain the highest-priced suites, at around $25 dollars on average more per night than Cars or Lion King–and $125 more a night than All-Star Music.
Season price increases
For 2018, average year-round prices in standard rooms in the All-Star Resorts are up around 7.5%, with the lowest increases of ~1.5% in the Easter and Holiday seasons and large increases of 6-9% the rest of the year, especially in the Fall season. Preferred rooms show similar patterns but at lower levels, averaging a 6% increase. Moreover, more rooms seem to be priced as preferred than before, such as Jazz at Music and Touchdown at Sports, itself in effect a price increase. Family Suites at Music are up 6.2% and show the same seasonal patterns, including the highest increase of 7% in the Fall season.
Pop Century standard rooms showed the highest increases for 2018 among the values, up year-round at 8% in both standard and preferred rooms. The largest standard room increases are in the Value (9.3%), Regular (9.1%) and Fall (8.1%) price seasons, and the lowest (but still >5%) are in the Easter and Holiday seasons. Preferred rooms at Pop also went up an average of 8% and show similar seasonal patterns, but here the biggest increase is for the Regular season at 9.7%. The price increases are likely related to the new queen beds and coffeemakers that are beginning to show up at Pop Century.
Little Mermaid rooms at Art of Animation followed up their 9% increase in 2017 with more moderated 6.4% increases for 2018. Increases are highest in the Regular (9.1%) Value (8.2%) and Fall (6.7%) seasons, and lowest in the Peak, Summer and Holiday seasons.
Art of Animation Family Suites at Cars and Lion King are up an average of 6% for 2018. Increases are pretty tightly grouped across the year, but are highest in the Fall season (7.1%) and lowest in the Easter and Holiday seasons (both 4.6%). Finding Nemo 2018 increases are similar.
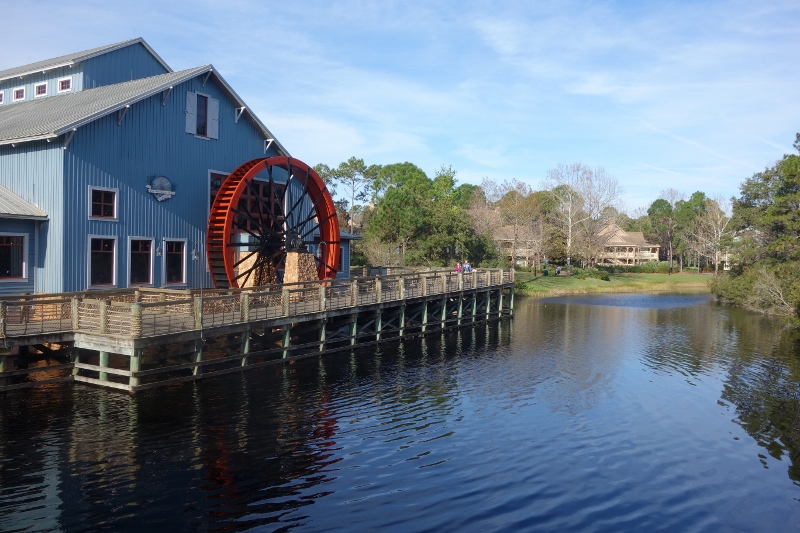
DISNEY WORLD MODERATE RESORTS PRICING IN 2018
Price season structure
The moderates saw for 2018 the same insertion of Regular season nights into early February, and the same new Sunday and Thursday pricing in some price seasons, that the values did. See the discussion above for details.
Price level changes
Until 2016, Caribbean Beach, Port Orleans French Quarter, and Port Orleans Riverside standard rooms had the same prices, while Coronado Springs tracked them some nights and other nights was $3-5 more.
In a major change, in 2016 Riverside and French Quarter became the most expensive moderates. This gap widened substantially in 2017, and widens a bit more in 2018.
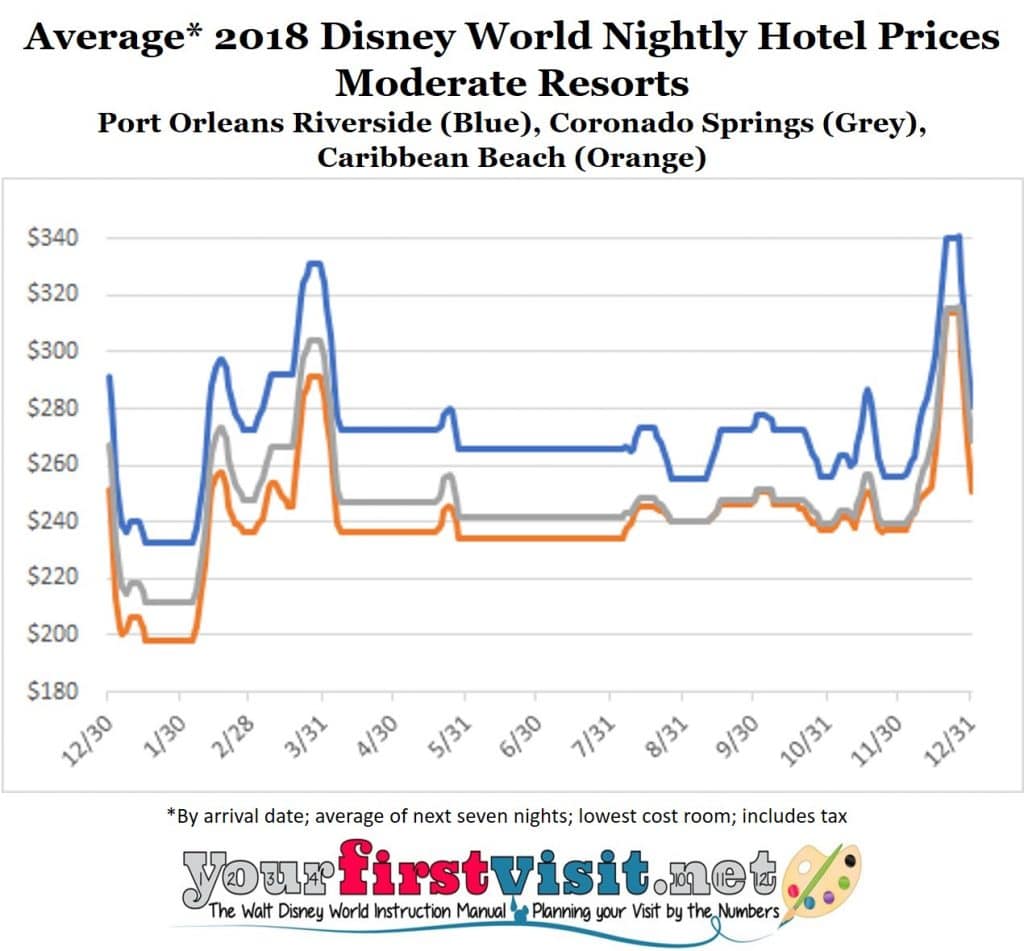
In 2018, standard rooms at the Port Orleans resorts average $23 a night more than Coronado Springs, and most of the year $32/night more than Caribbean Beach. (Caribbean Beach largely returns to prices comparable to Coronado Springs in late 2018.)
Season price increases
Coronado Springs standard rooms show average price increases for 2018 of 5.7%, with the biggest increases in the Value (8.4%) and Fall (7.2%) seasons. Preferred rooms at Coronado Springs are up 4.6% with a range across seasons of 4-5%, except the Easter season, up only 2.8%.
Caribbean Beach prices for 2018 show a fascinating pattern, with almost no increases in any room type (I checked out 5 types) during any of the seasons that launch in the first half of the year, but 4-6% increases in the two seasons that first appear in the second half of the year–the Fall and Holiday seasons. I imagine this pattern is from the refurb/construction that’s happening there, and the pattern–the Fall season opens in late August–gives a suggestion as to when this work will be done.
Prices for Port Orleans French Quarter and Port Orleans Riverside standard rooms, after rocketing up 7-9% across all the major seasons in 2017, see an average increase of 6.4% in 2018, with prices across all major seasons going up 5.5 to 7%. This is higher than the 2018 increases at either Coronado Springs or Caribbean Beach, and thus widens the price differential of the Port Orleans resorts with the other two traditional moderates that we first saw in 2016.
Preferred rooms at Riverside and River View rooms at French Quarter show similar increases.
DISNEY WORLD DELUXE RESORTS PRICING IN 2018
Price season structure
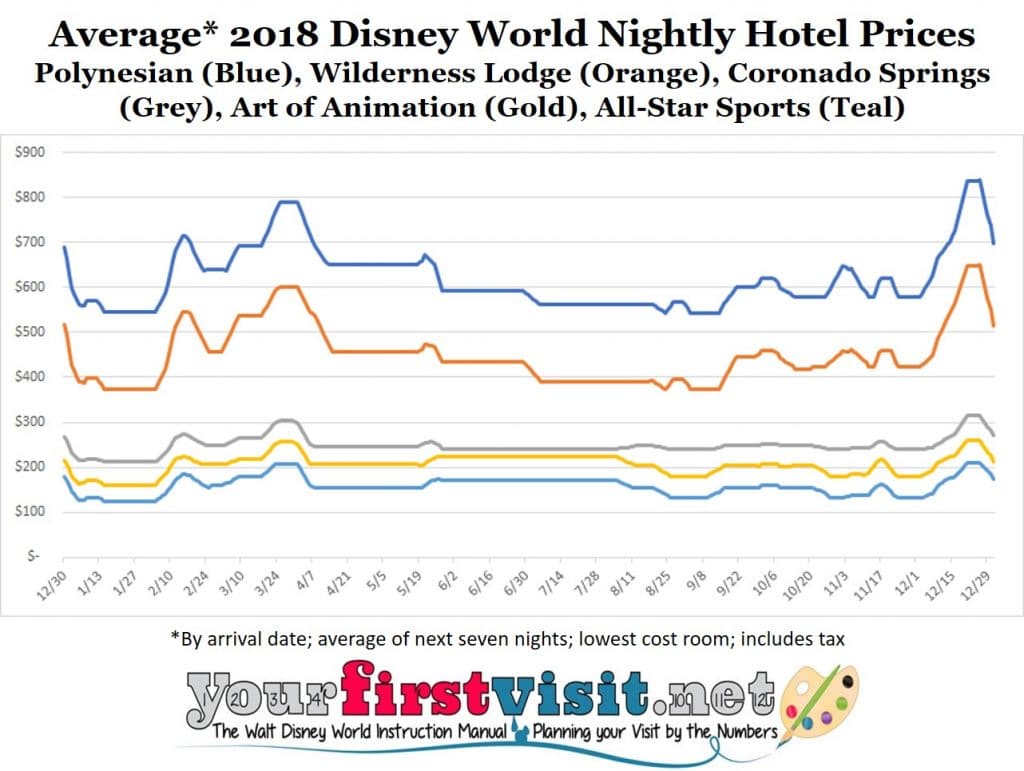
The deluxe resorts run to a different price season calendar than the values and moderates, especially from early July through mid-November.
Their 2018 price season calendar is similar to that of 2017, with the main change being the addition of a few more days of Peak season pricing the week after the Easter season.
The deluxes also see in 2018 the added complexity in day-by-day prices as the values and moderates, but not so much–only for three seasons (Value, Peak, Regular), not four, and typically only for Thursday nights, not the Sundays and Thursdays of the other resort classes.
Price level changes
There’s a bewildering plethora of price points at the deluxes—many view options, with “Club” service options as well. I sampled the full set of price changes in eighteen deluxe room types, and based on that saw no material changes among the overall resort price standings.
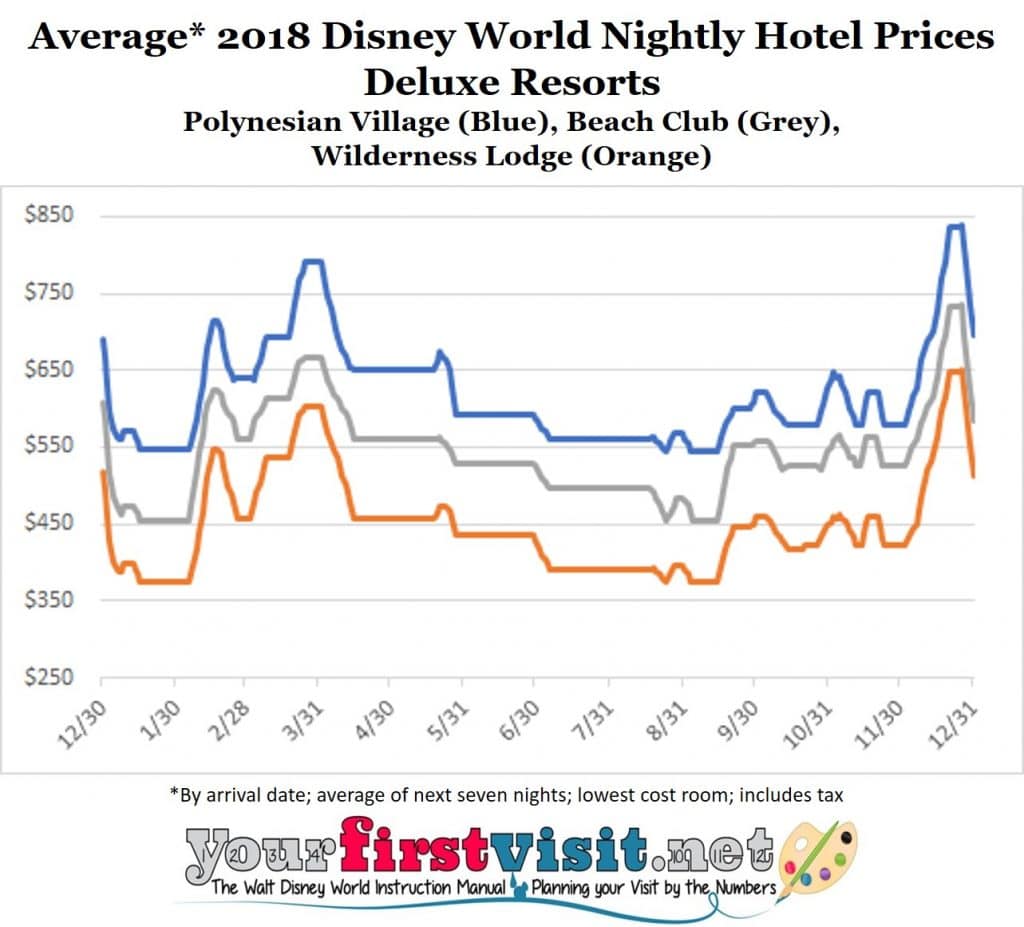
The Grand Floridian is still the most expensive, and standard rooms at the Wilderness Lodge are still largely the least expensive (some seasons, standard view rooms at Animal Kingdom Lodge are cheaper).
In general, there’s three price groupings among standard deluxe rooms. The three monorail resorts–the Grand Floridian, Polynesian and Contemporary–have the most expensive standard deluxe rooms, the Epcot resorts the Yacht Club, Beach Club, and BoardWalk Inn the next most expensive, and standard rooms at the Animal Kingdom and Wilderness Lodges the least expensive. Price differences vary across the year, but as you can see in the chart above, are on the order of $100/night for each group.
Season price increases
After restrained price increases in 2017, most deluxe rooms are up 5-7% for 2018, with the exception being the Grand Floridian, which for the second year in a row has seen next to no increases.
Polynesian Village standard view room prices were essentially unchanged in 2017, and have gone up 5.1% for 2018. Prices increases are tightly grouped in all principal 2018 seasons except the Regular 2 season, when they go up only 2.6%. Poly lagoon view prices are up 4.2% for 2018, tightly grouped all major seasons except for the Fall season, when they go up just 2.6%.
Contemporary Resort Tower Bay Lake view rooms were unchanged in 2017 in most seasons, and have increased by 5% for 2018. Increases are tightly grouped around 5% except for the Regular 2 season, up 7.1%. Theme Park view Tower rooms here saw 3.4% increases in 2017, and are up 7.4% for 2018. Peak, value and regular season prices all went up more than 8%. Other seasons see increases of 5-7%.
Grand Floridian standard view rooms had an average increase of 1.3% in 2017, and in 2018 have no increase. Two other view types I checked also had no increase for 2018.
Wilderness Lodge standard rooms, after an average 5.4% increase in 2017, are up another 5.9% for 2018. Season increases are tightly in the 5-7% range. Courtyard view rooms here average a 6% increase.
BoardWalk Inn standard view room prices, after being largely unchanged in 2017, are up on average 5.7%, tightly grouped among the seasons with 4.6% to 6.3% increases. Water view rooms here are up 5% and show the same pattern of a narrow range of increases across all 2018 major seasons.
Standard view rooms at the Yacht Club and Beach Club are up for 2018 5.5% on average, grouped among seasons from 4.5% to 6%. The next most expensive room class in each are both up around 5%, also with a tight grouping in price increases for the seasons.
Animal Kingdom Lodge standard room prices are up an average of 6% in 2018 after a 2% rise for 2017. Increases are tightly grouped across the major seasons in the 5-7% range. Savanna view rooms went up about 3% in 2017, and are up 6.2% for 2018.
MORE ON THE DISNEY WORLD RESORTS
I’ve stayed in more than 140 different Disney World-owned rooms, suites, villas, and such. Reviews resulting from these stays are linked to here.
Follow yourfirstvisit.net on Facebook or Twitter or Pinterest!!
July 5, 2017 7 Comments
The Week of 12/16/17 Will Be Better Than I’d Thought
DISNEY WORLD CROWDS THE WEEK OF 12/16/2017
I messed up my Disney World crowd forecast for the week of December 16, 2017. I’d expected on the order of 30% of us schoolkids to be off by 12/16, like in 2016, but in fact only about 10% are.
As a result, I’ll be revising the crowd forecast for this week from “high” to “moderate-plus.”
Moderate-plus for the week of 12/16/17 represents the overall average of the nine days from 12/16 through 12/24–these dates will be better than that at the beginning, and worse than that at the end.
SHORTER PATHETIC EXCUSE FOR GETTING THE WEEK OF 12/16/17 AT DISNEY WORLD WRONG
For the first time since 2006—well before I began forecasting Disney World crowds—Christmas in 2017 is on a Monday. I didn’t have enough experience with Monday Christmases to get it right…
LONGER PATHETIC EXCUSE FOR GETTING THE WEEK OF 12/16/17 AT DISNEY WORLD WRONG
Every year I publish draft crowd calendar in the fall for the year that begins ~15 months ahead, and then update it the summer before.
The draft is based on experience and judgment, and the later update is based on analysis of actual school breaks for the coming year school year.
My school break analysis is based on the actual schedules of more than 15 million kids in more than 270 school districts, weighted by state based on that state’s proportion of the 12 million visitors to this site (as a proxy for the propensity of families from that state to go to Disney World).
It comes so late in the year because so many districts don’t publish their calendars for the upcoming school year until May or even June. (BTW, because district calendars are largely not out yet, most of Michigan is still missing in detail from my datasets, but required common county calendars let me get Michigan Christmas breaks for this analysis.)
Part of Christmas is easy to forecast, and part is harder.
This is because there are two typical Christmas breaks—short breaks and long breaks.
- Districts that take short breaks are out as close to December 25 to January 1 + a day or two as the calendar lets them be—a weekend New Year’s Day will put them back in school the Tuesday after it. Depending on the day of New Years, the shortest of the short breakers can have a break as short as 8 days. In 2017, the Monday holidays means the shortest possible break is ten days.
- Districts that take long breaks are also off during this period—which is the easy part of the forecast, the parks will be mobbed for December 25 though December 31. They typically take at least two full weeks—with three weekends—off, and so are out a minimum of 16 days.
Here’s the distribution of actual break lengths for the 2017/2018 holidays (it’s not weighted):
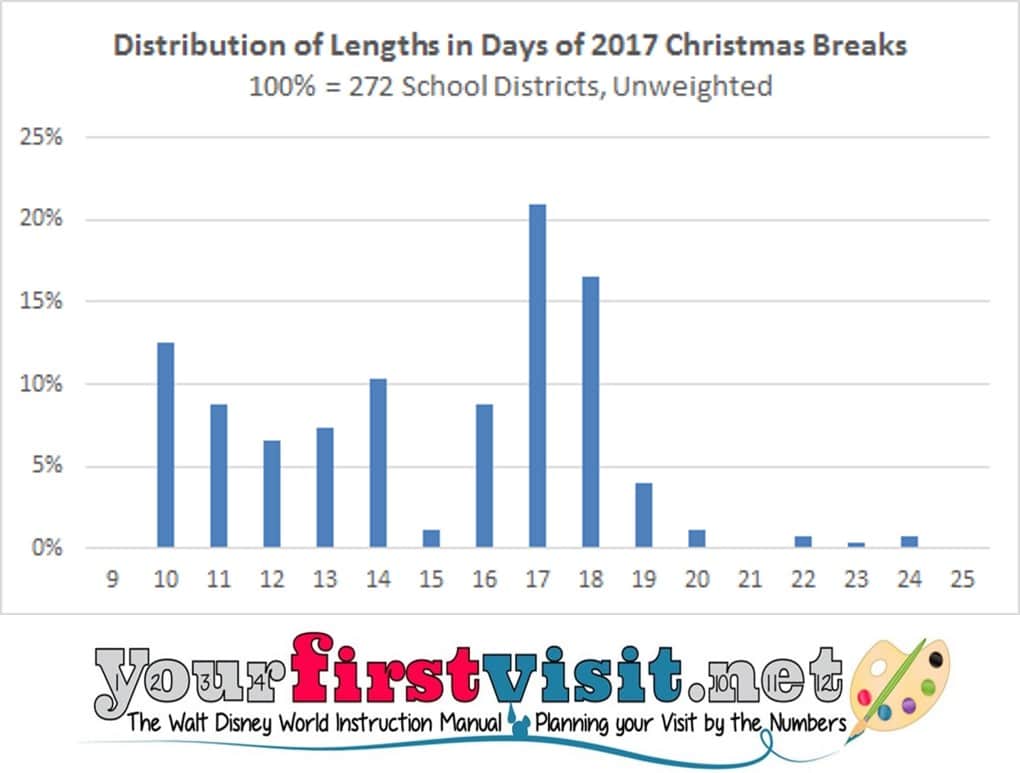
If you sum, you’ll find about half of districts are long-breakers, and a tad less than half are short breakers. (The rest are in the right-side tail of really long breakers…)
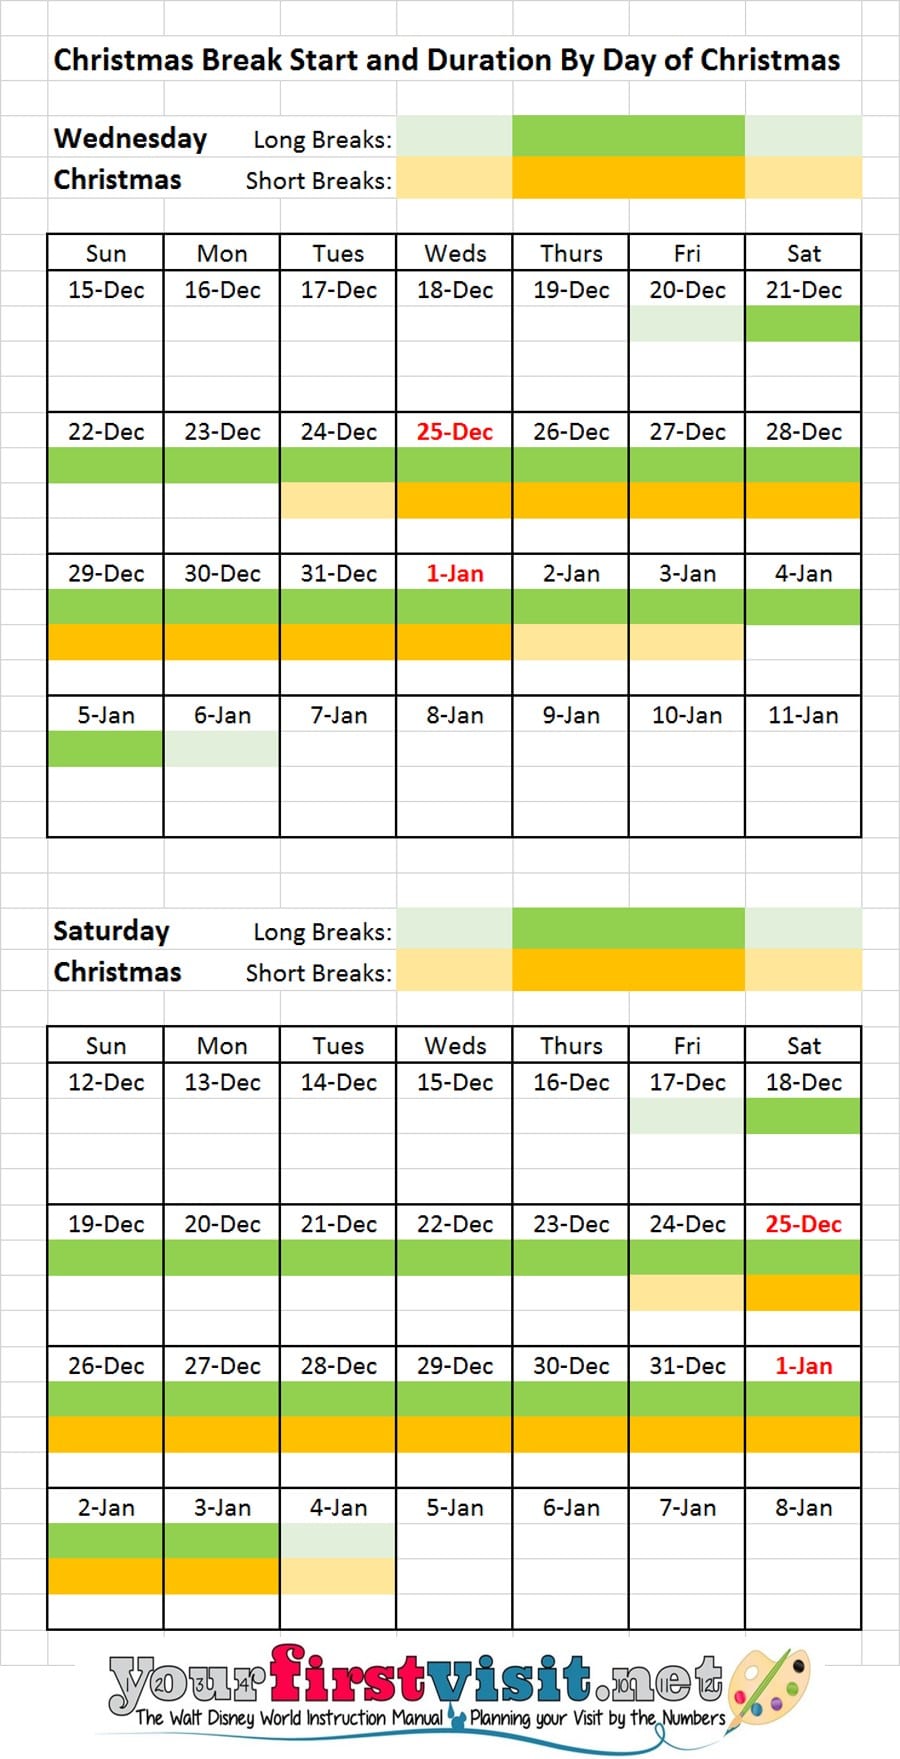
The long breakers are the problem, as the day of Christmas shapes whether their breaks starts well before Christmas or not. A Wednesday Christmas makes forecasting easier—the vast number of long breakers facing a Wednesday Christmas will start their break the weekend before, on 12/21, and end it two weeks later on 1/5. A Saturday Christmas is harder to forecast, but many districts will begin their breaks a week before, on 12/18, and end on January 4 (not the third, as the holiday will be observed then).
Here’s the same point made (well, perhaps it’s made) graphically, with the long-breakers in green:
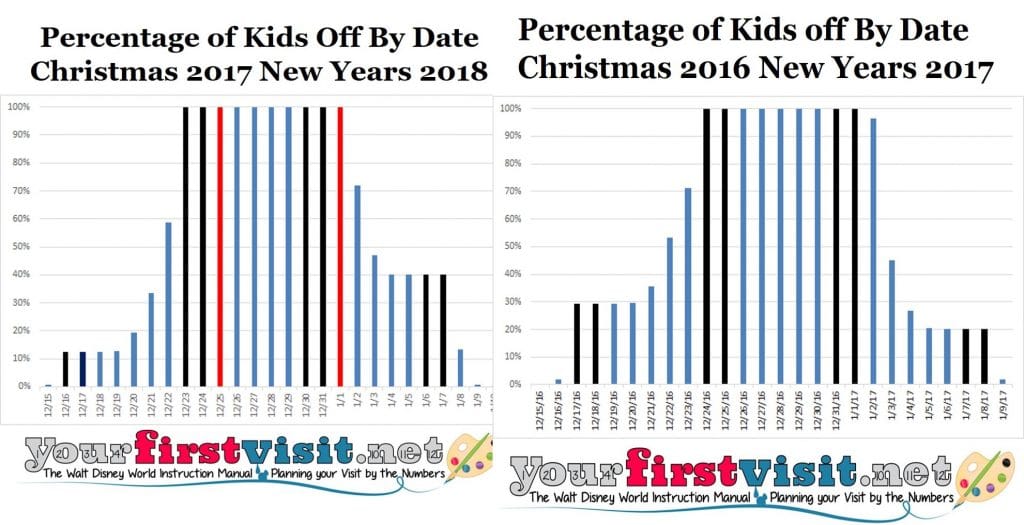
In 2016, Christmas was a Sunday, and as a result many long breaks went from 12/17/16 to 1/2/17. Thirty percent of kids were off the week beginning 12/17/16.
With the Monday Christmas in 2017, I expected a similar pattern—but as noted above, this is the first Monday Christmas since 2006, so I did not have solid data.
Now I do—and have discovered that only 10% of kids are out on 12/16/17, and the more common long break in 2017-2018 is from 12/21, 12/22 or 12/23 through 1/7.
This shows the distribution of breaks in 2016-2017 and 2017-2018:
OK so now I know better, and promise to do better the next time we have a Monday Christmas, which will be in 2023…
Follow yourfirstvisit.net on Facebook or Twitter or Pinterest!!
May 29, 2017 4 Comments
Copper Creek Villas at Disney’s Wilderness Lodge
Last week Disney World announced that the new Disney Vacation Club spaces at the Wilderness Lodge would open for booking in later March for visits beginning in mid-July.
Floor plans are available in places like this.

The already existing DVC villas here have been renamed as “Boulder Ridge,” and the new villas are called “Copper Creek.” The new name
- Enables different DVC contracts (regular, non-DVC folk can stay here by renting points, or cash like any other room)
- Signals differences between the new Copper Creek floor plans and the old Boulder Ridge ones, and
- Will require me to spend hours cleaning up the proper nomenclature on this site (and in our book)
Rather than do all that work now, I thought I’d comment instead on the apparent differences in floor plans for comparable spaces at Boulder Ridge and Copper Creek, and also compare Copper Creek’s Grand Villas and Cascade Cabins to alternatives.
Obviously I haven’t stayed in Copper Creek yet–no one has. So the following observations come from floor plans.
- The nice-looking, smaller floor plans are from me and of the older rooms in Boulder Ridge
- The larger, cartoony ones are from Disney and are of the new rooms in Copper Creek.
Copper Creek is largely a redo of old southeast wing Wilderness Lodge standard rooms, but there is also a new stretch of lakeside cabins along Bay Lake.
STUDIOS, ONE AND TWO BEDROOM VILLAS IN COPPER CREEK
In general,
- Balconies are better in Copper Creek–larger, and present in every bay.
- Decorating and art look much better in Boulder Ridge (although I’ll reserve judgment a bit on that until I stay in these rooms in person).
Which Studio you prefer is a function of whether you view the fold-down third bed/fifth sleeping spot in Boulder Ridge that disappears the dining table more as a feature or a bug. For most, if you don’t need the extra sleeping spot or capacity, Copper Creek will be the better choice.
The biggest difference to the One and Two Bedroom Villas is that Copper Creek can seat many more at the dining table, making it a better choice.
Complicating all this for Studios, One and Two Bedroom Villas is the theming differences between the old Boulder Ridge building and the refurbed Wilderness Lodge wing that holds these spaces for Copper Creek.
The glory of the Wilderness Lodge is its lobby; those staying in Copper Creek will see more of its lobby; QED.
However, Boulder Ridge has a real charm of its own, has better decor and colors, is closer to the bus stop (but farther from the Magic Kingdom boat), and will likely be more tranquil than Copper Creek.
GRAND VILLAS AND CASCADE CABINS AT COPPER CREEK
There’s no Grand Villas in Boulder Ridge to compare the Copper Creek Grand Villas to, but compared to other DVC grand Villas those in Copper Creek are astonishing.
The Cascade Cabins also have nothing comparable at Boulder Ridge, but are similar to the Bungalows at the Polynesian, without the theme park view. I am a tad troubled by the potential for people to confuse these with the Cabins at Fort Wilderness (more people than you’d guess mix up the two resorts, or think they are the same thing).
STUDIOS AT COPPER CREEK
Copper Creek Studios have a larger balcony and a smaller closet than those in Boulder Ridge.

They also do not include the fold-down bed that makes the table go away when it is used.
This apparently means that these rooms will sleep 4 on two spots, rather than 5 on three spots…but the strange dashing on the coffee table in front of the sofa makes me wonder if this is an ottoman bed a la All-Star Music Family Suites.

Reactions to the fold down bed in Boulder Ridge have been mixed, with some loving the extra sleeping spot and added capacity, and others resenting that, when used, it takes the table away.
ONE BEDROOM VILLAS AT COPPER CREEK
You’ll see varying figures for the size of One Bedroom Villas at Copper Creek. Since they are built on the bays of two old standard rooms, this is pretty straightforward–they are 680 to 690 square feet, depending on your source for Wilderness Lodge room sizes.

One Bedroom Villas at Copper Creek also have the larger balconies and smaller closets of the Copper Creek Studios.
The king bedroom side and bath have similar amenities and layouts to Boulder Ridge, but with more right angles.

The floor plan of the living/dining/kitchen side–and the only good artist’s rendering that I’ve found of Copper Creek spaces–shows some distinctive changes.
Note that the dining table seats six, a big increase compared to Boulder Ridge, although those chairs look awfully cramped–and also note the unusual “across the hall” positioning of the refrigerator. However, the breakfast bar is gone.
Finally, I am not at all keen on what the rendering shows as the color scheme or the art, but willing to reserve judgment until I see these spaces in person. Other Disney renderings of the Copper Creek spaces I have seen–too small to post here–show equally uninteresting color and art choices.
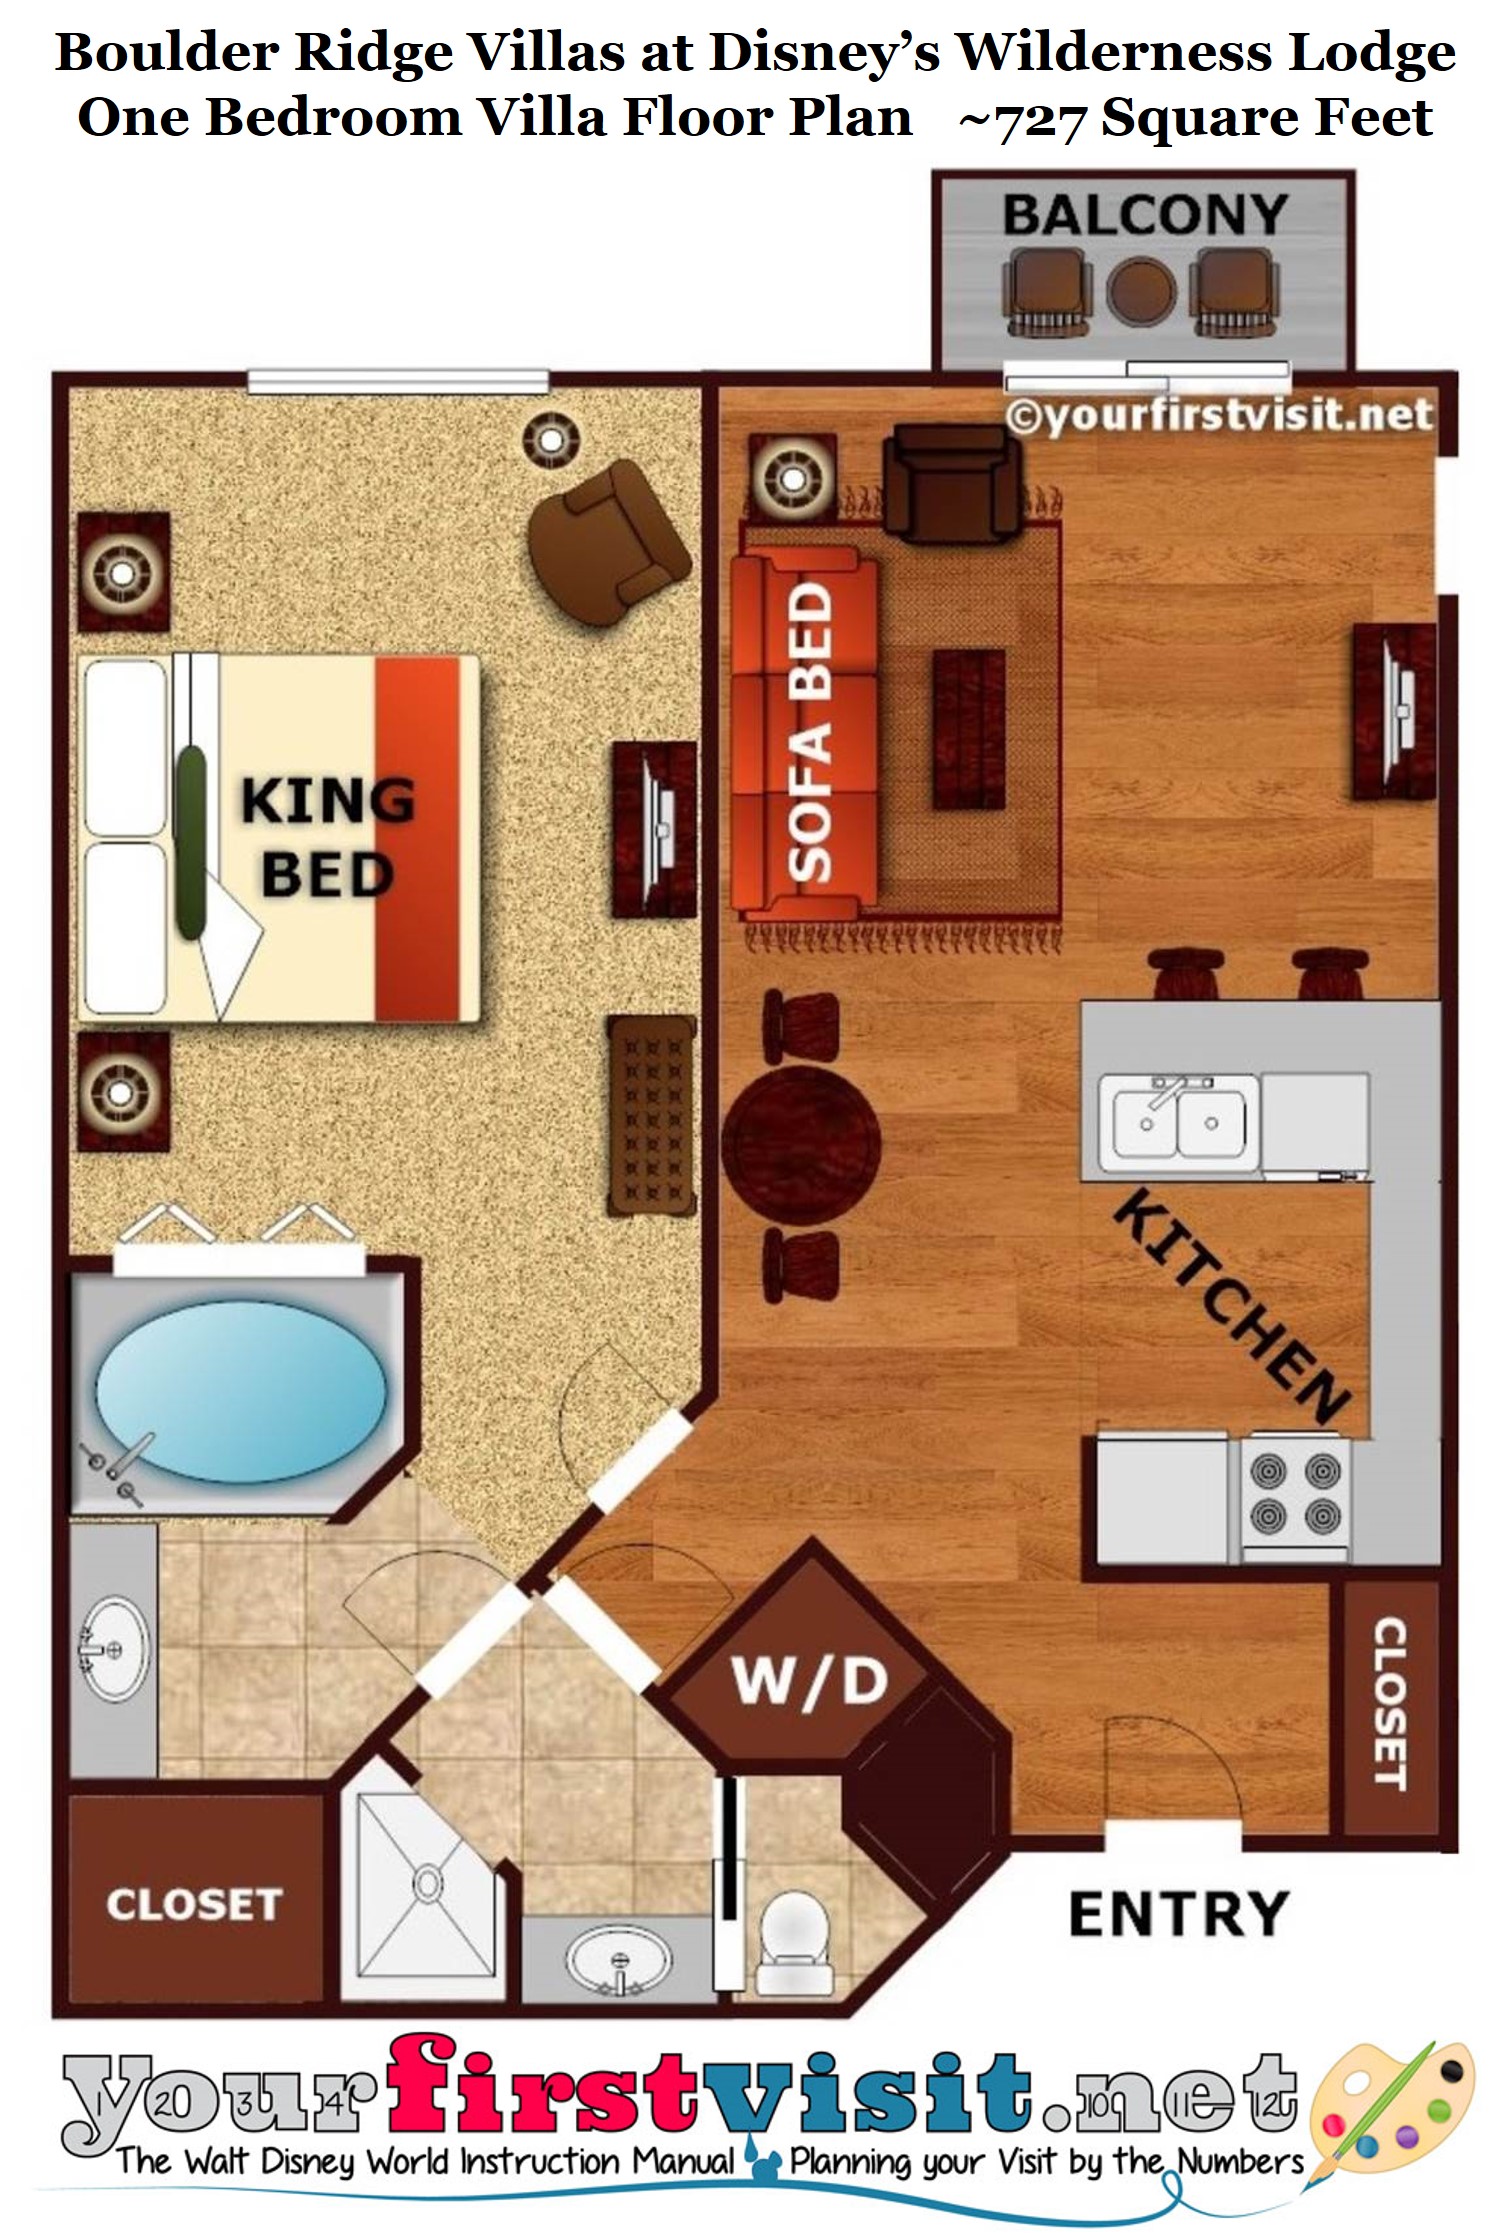 The living room seats four, the same as Boulder Ridge.
TWO BEDROOM VILLAS AT COPPER CREEK
There’s two types of Two Bedroom Villas at Copper Creek.
 The “lock-off” (shown) combines a Studio and One Bedroom, and shares the merits of the spaces that make it up.
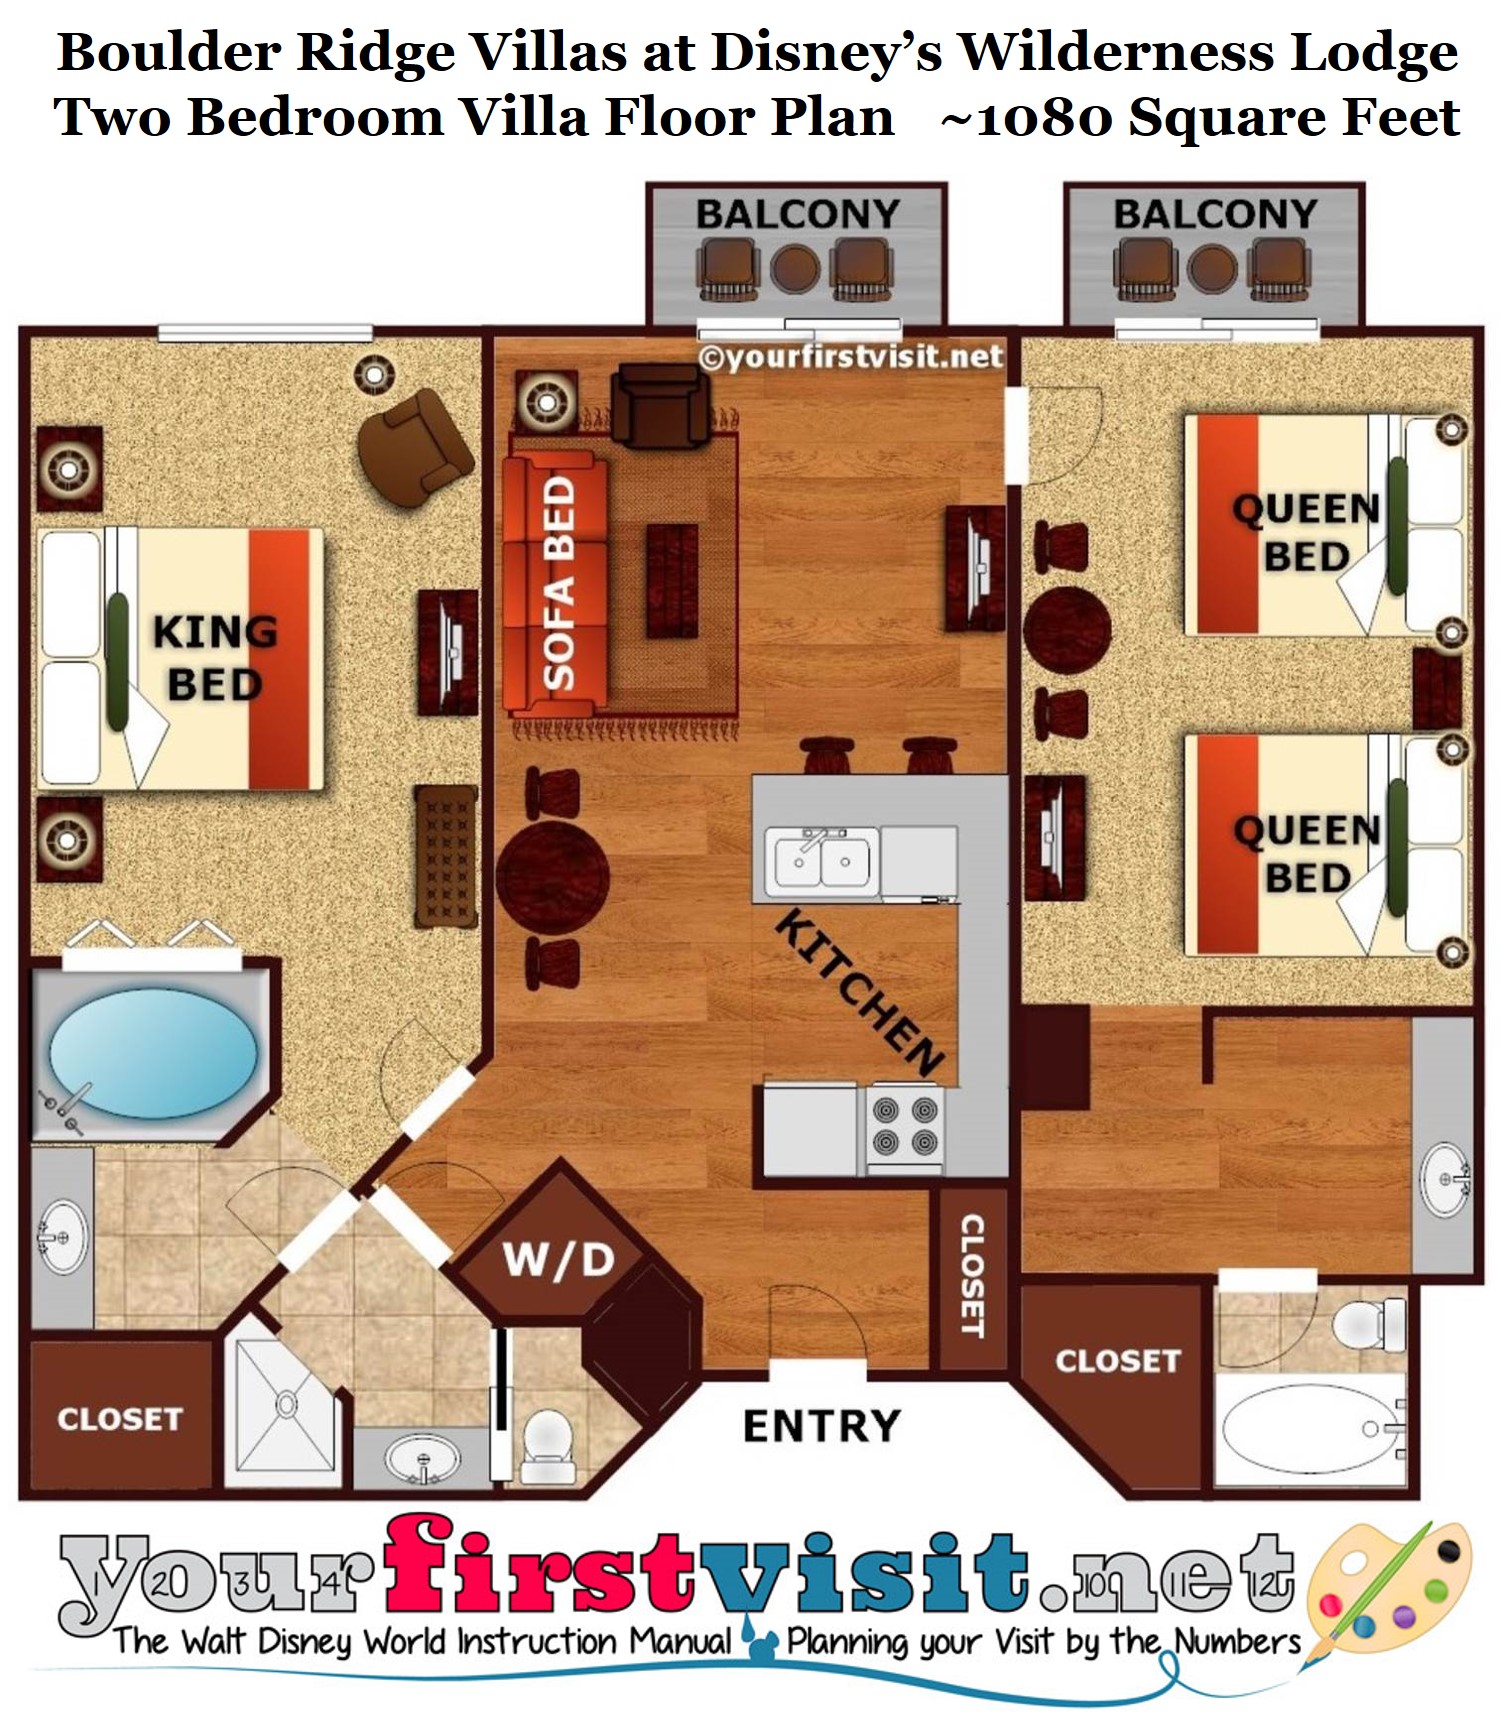
The dedicated Two Bedroom Villa (not shown) was designed from the start as a Two Bedroom Villa, and has differences in the second bedroom–two queens instead of the queen and sofa bed of a Studio; no microwave or mini-fridge; two bath sinks; no separate entry to the hall; and a shower instead of a tub.
ALTERNATE STUDIOS AND VILLAS
The corners of the wing of the Wilderness Lodge that Copper Creek was built into used to have deluxe rooms with an odd floor plan that included two spaces.
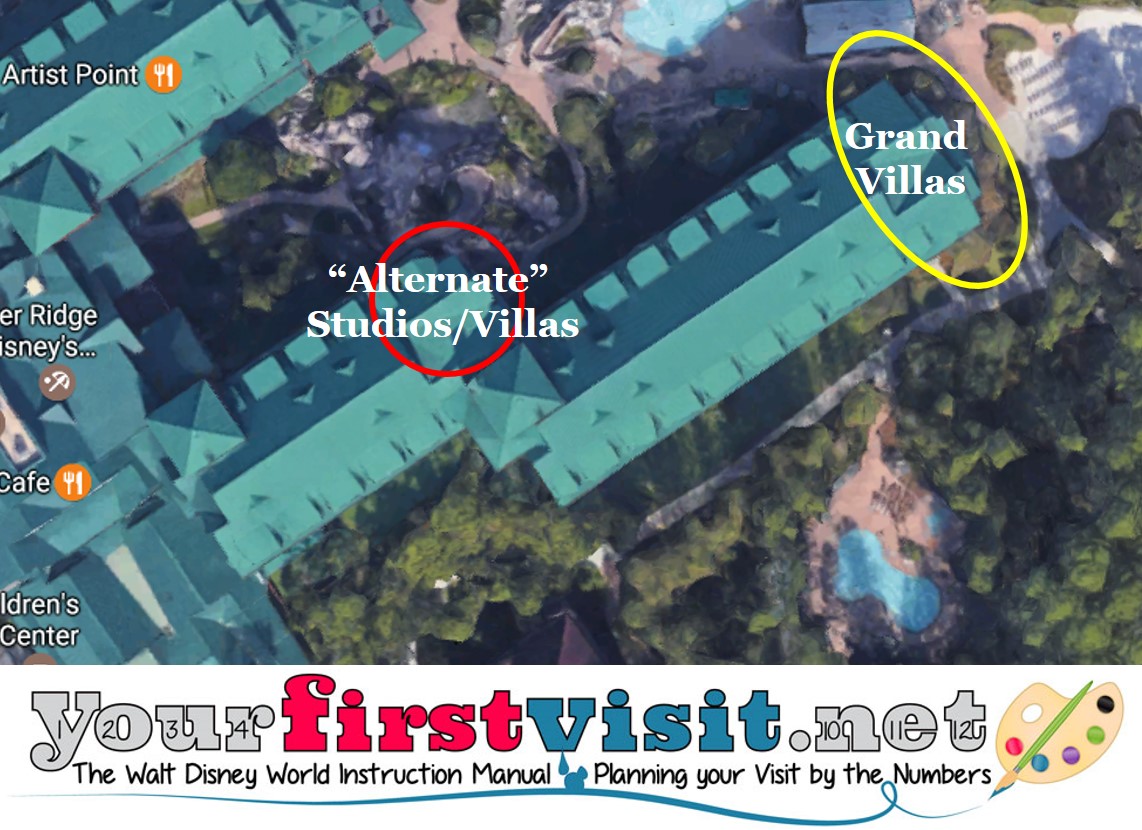
While most of these have been turned over into Grand Villas, a half-dozen or so have been built as “Alternate Studios” with more space and a separate living room.
These can be combined with a fairly standard One Bedroom Villa (the connecting door looks to be in a different spot) into an “Alternate Two Bedroom.”
GRAND VILLAS AT COPPER CREEK
There somewhere between 4 and 6 Grand Villas at Copper Creek (I think there’s 4) that combine two old deluxe rooms, three old standard rooms, an alcove, and–I think–some hall space.
Some have reported these to be more than 3,200 square feet, but the two deluxe rooms and three standard rooms sum to just a little over 2,000 square feet, requiring more than a thousand square feet of hall and alcove space, which I don’t believe for a minute. So I am estimating them as ~2,500 square feet.
 Whatever the size, these are glorious spaces, with what looks like the best living rooms, dining rooms, master baths, and suite of balconies among the DVC Grand Villas.
There is some awkwardness among the two two-queen bedrooms, with the more distant one (lower left) having a private bath and balcony, and the one closer to the Master Bedroom sharing a hall bath and sharing a balcony with the master.
This can lead to much bickering…

The latest Grand Villas to open before these, at the Grand Floridian, have the merit of what is in effect a fourth bedroom, in the media room. But most other DVC Grand Villas have the three bedrooms that you’ll find at Copper Creek Grand Villas, and nothing as nice as its living and dining rooms.
CASCADE CABINS AT COPPER CREEK
The only part of Copper Creek to not be built in the Wilderness Lodge is the lakeside Cascade Cabins.
These cabins are pretty similar to the Bungalows at the Polynesian, with a different kitchen wall and what appears to be a (more comfortable) fold-out chair rather than a fold-down bed in the living room.

Prices for these are not out, so far as I know, but likely will be comparable to that of Copper Creek Grand Villas.

If the prices for these cabins come out to be as high as I think they will be, I don’t know why anyone would stay in one of these…
OK, that’s it for now. I’ll do a full review after my stay at Copper Creek this summer!
Follow yourfirstvisit.net on Facebook or Google+ or Twitter or Pinterest!!
March 8, 2017 4 Comments