
Category — Disney World Price Seasons
Disney World Resort Price Changes for 2018
Disney World’s 2018 resort hotel prices were released on June 20.
You can book them by contacting Kelly B at KellyB@DestinationsInFlorida.com or 980-429-4499.

The prices that came out June 20 were a bit of a mess, particularly for January 2018, and have changed several times since–see the Art of Animation example (click it to enlarge it):
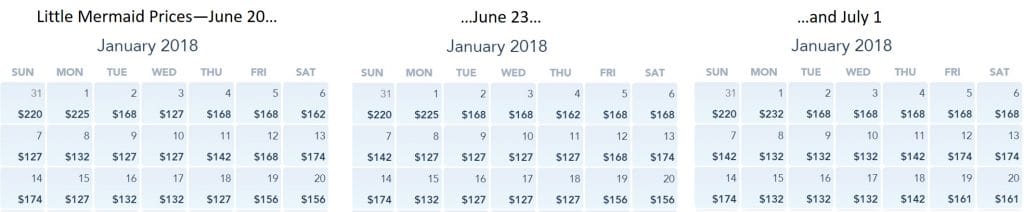
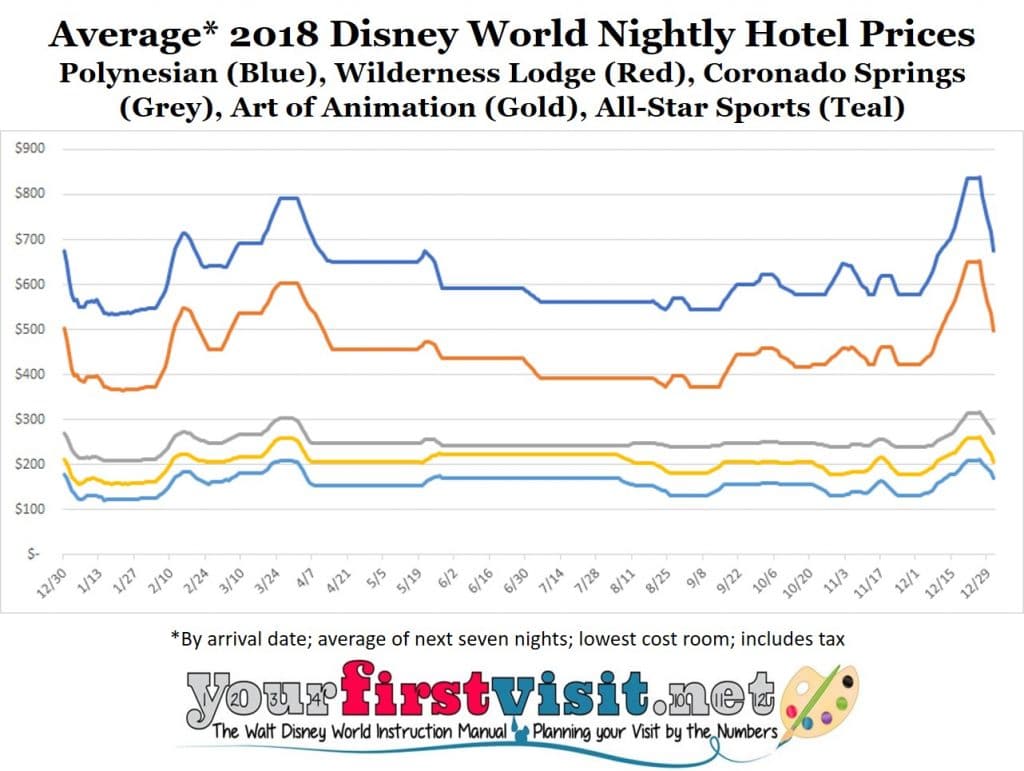
They seem to have stabilized, however, so I’ve been analyzing a sample of resorts, and the upshot is that compared to the quite restrained price increases we saw in 2017, prices are up substantially in most–though not all–resorts in 2018.
Only Caribbean Beach and Grand Floridian see very small price increases for 2018. 2018 Value resort prices are up 6-9%; 2018 moderate resort prices (except Caribbean Beach) are up 5-7%; and 2018 deluxe prices (except for Grand Floridian) are up 5-7%.
(Reviews of all Disney World resort hotels mentioned in this pricing round-up are linked to from here–I’ve stayed in more than 140 different Disney World hotel rooms, and my reviews are based on these stays.)
The other thing that’s new for 2018 is more distinctions among day prices in the same price seasons. For many (but not all) major seasons, you’ll see new Thursday prices, and in the moderates and values some new Sunday prices as well.
Analyzing Disney resort price changes is difficult—there’s more than 20 hotels, many differently-priced room and view types within them, seven to nine different major price seasons over the course of the year, additional weekend and holiday upcharges, and more. As a result, unless you have a LOT of time on your hands you need to sample, and that’s what I’ve done.
In general, I gather daily price data on the lowest and next-highest priced rooms at all of the resorts (and from more room/price combos if a resort looks odd, as Caribbean Beach and Grand Floridian do in 2018), and then analyze:
- Season price increases across all the major Disney World price seasons—e.g. “Regular” season prices for 2018 compared to 2017
- Changes in the dates covered by price seasons that have an impact on price levels—only a bit of that happened for 2018
- Changes in the relative price levels of hotels in a single price class—2018 saw little change here.
For 2018 I sampled 40 room types across the seven major price seasons at the values and moderates and the nine major price seasons at the deluxes. This yielded more than 500 points of comparison between 2018 and 2017 prices.
In what follows, when I talk about price changes for the entire year I mean seasonally-weighted price changes (that is, weighted based on the percentage of 2018 days in each major price season–there’s seven major seasons at the values and moderates, and nine at the deluxes), and when I talk about a specific price season increase I am comparing average Sunday night to Saturday night prices across the two years, to account for the different prices on different days problem. So yes, it is some spooky genius math shit.
The detailed results follow.
DISNEY WORLD VALUE RESORTS PRICING IN 2018
Price season structure changes
2018 largely maintains the recent 2017 seasonal structure at the values, although with the day changes noted below. One minor twist is the addition of a few days of Regular season in February (beginning 2/11/18) that were Value season in 2017. (This is a reversion to a pattern we first saw in 2016.)

For those who were not paying attention, several years ago Disney introduced the “Fall” price season, which replaced what used to be Value season dates in late November and early December. In 2016, Disney implemented more seasonal changes at the values and moderates, in effect raising prices by moving various dates from lower to higher-priced seasons. Value 2 dates in later August and early September shifted to Fall, and Fall in later September to almost the end of October was shifted to Regular.
Up until 2018, rooms typically had one or two prices during a season. If two, there was one price for Sunday-Thursday and another for Friday and Saturday.
2018 sees more variety in daily prices during the Value, Regular, Fall and Peak seasons. The typical pattern is now Price A Sunday, Price B Monday-Wednesday, Price A again Thursday, and Price C on Fridays and Saturdays.
Here’s an example from Art of Animation during the 2018 Value season:
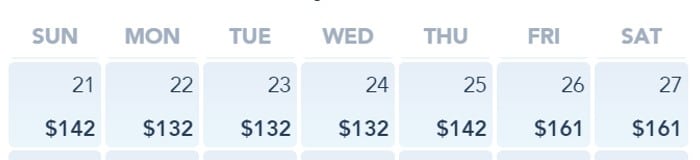
The effect of this is to make long weekend stays more expensive, and Monday-Wednesday stays less expensive, than would otherwise be the case. This is a somewhat mechanical start (mechanical because at the values, the difference between Price A and Price B is typically a flat $10 across resorts and seasons) to a set of prices that more fully reflect differences in demand by night.
Finally, the much earlier Easter in 2018 means that many more days in March-April will be regular season, and that many less Peak or Easter seasons, than in 2017. The difference is about two weeks more worth of Regular season prices, mostly in April.
Price level changes
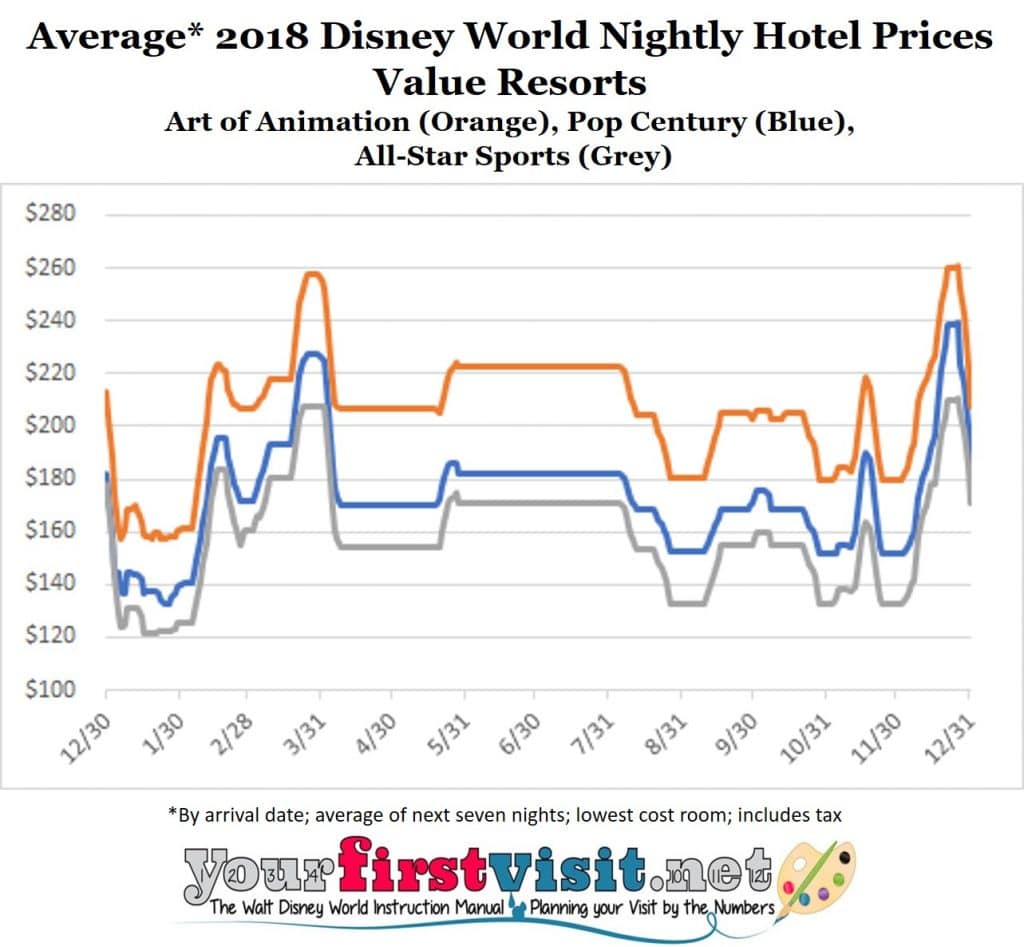
The basic pattern among value resort standard rooms of Art of Animation Little Mermaid rooms being most expensive and the All-Stars being least expensive continues in 2018.
Pop Century rooms see the highest increases for 2018, bringing them a bit closer to the Little Mermaid rooms, but prices in the other value resorts go up quite a bit as well. Little Mermaid rooms remain shockingly close to standard moderate room prices some dates (especially in the Summer season in 2018, where a week in a Little Mermaid room averages $223 a night and a week in Caribbean Beach, which sees no material 2018 price increases until its Fall season, $234 a night).
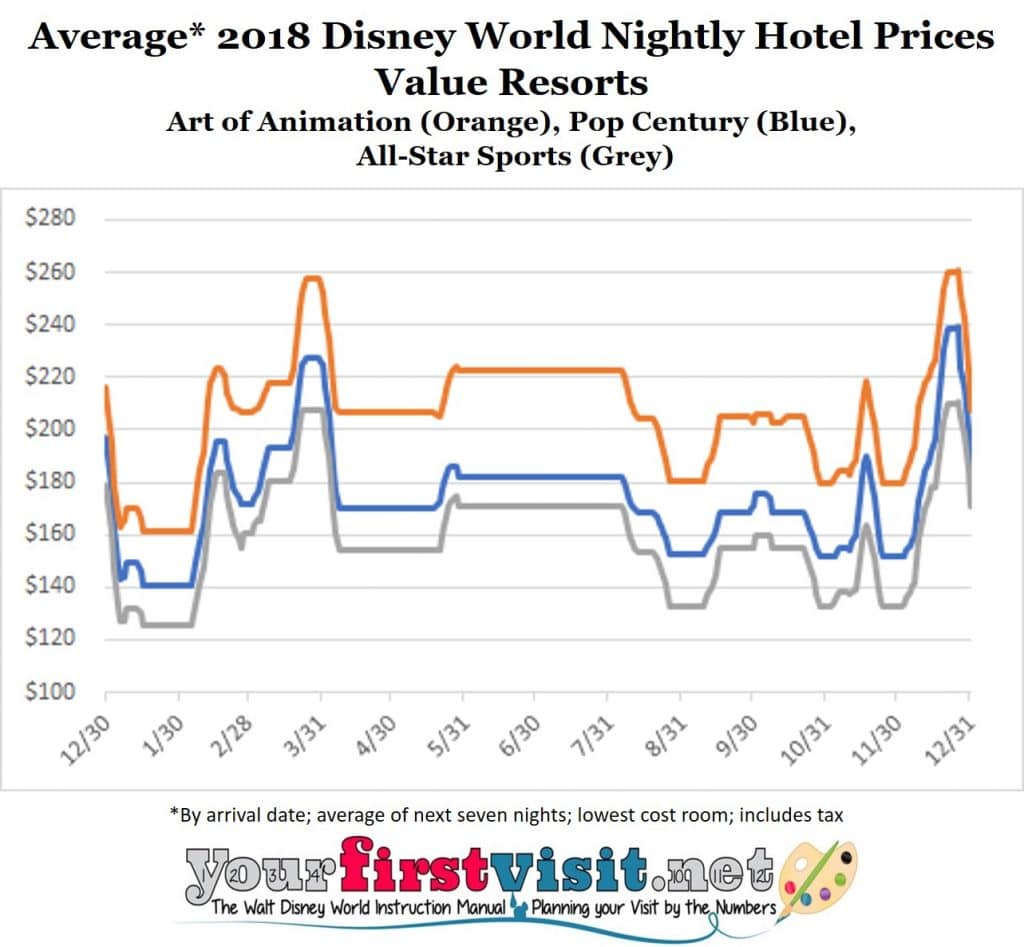
On average across 2018, Little Mermaid rooms are ~$30 more expensive per night than Pop Century and ~$45 more per night than the All-Stars. These differences are shown for standard rooms across the prices seasons in the chart.
Family Suite options at the values also continue their basic price structure. The suites at All-Star Music are the least expensive, The Cars and Lion King suites at Art of Animation are at a much higher level–averaging $100 more a night than those at Music—and the Finding Nemo suites at Art of Animation remain the highest-priced suites, at around $25 dollars on average more per night than Cars or Lion King–and $125 more a night than All-Star Music.
Season price increases
For 2018, average year-round prices in standard rooms in the All-Star Resorts are up around 7.5%, with the lowest increases of ~1.5% in the Easter and Holiday seasons and large increases of 6-9% the rest of the year, especially in the Fall season. Preferred rooms show similar patterns but at lower levels, averaging a 6% increase. Moreover, more rooms seem to be priced as preferred than before, such as Jazz at Music and Touchdown at Sports, itself in effect a price increase. Family Suites at Music are up 6.2% and show the same seasonal patterns, including the highest increase of 7% in the Fall season.
Pop Century standard rooms showed the highest increases for 2018 among the values, up year-round at 8% in both standard and preferred rooms. The largest standard room increases are in the Value (9.3%), Regular (9.1%) and Fall (8.1%) price seasons, and the lowest (but still >5%) are in the Easter and Holiday seasons. Preferred rooms at Pop also went up an average of 8% and show similar seasonal patterns, but here the biggest increase is for the Regular season at 9.7%. The price increases are likely related to the new queen beds and coffeemakers that are beginning to show up at Pop Century.
Little Mermaid rooms at Art of Animation followed up their 9% increase in 2017 with more moderated 6.4% increases for 2018. Increases are highest in the Regular (9.1%) Value (8.2%) and Fall (6.7%) seasons, and lowest in the Peak, Summer and Holiday seasons.
Art of Animation Family Suites at Cars and Lion King are up an average of 6% for 2018. Increases are pretty tightly grouped across the year, but are highest in the Fall season (7.1%) and lowest in the Easter and Holiday seasons (both 4.6%). Finding Nemo 2018 increases are similar.
DISNEY WORLD MODERATE RESORTS PRICING IN 2018
Price season structure
The moderates saw for 2018 the same insertion of Regular season nights into early February, and the same new Sunday and Thursday pricing in some price seasons, that the values did. See the discussion above for details.
Price level changes
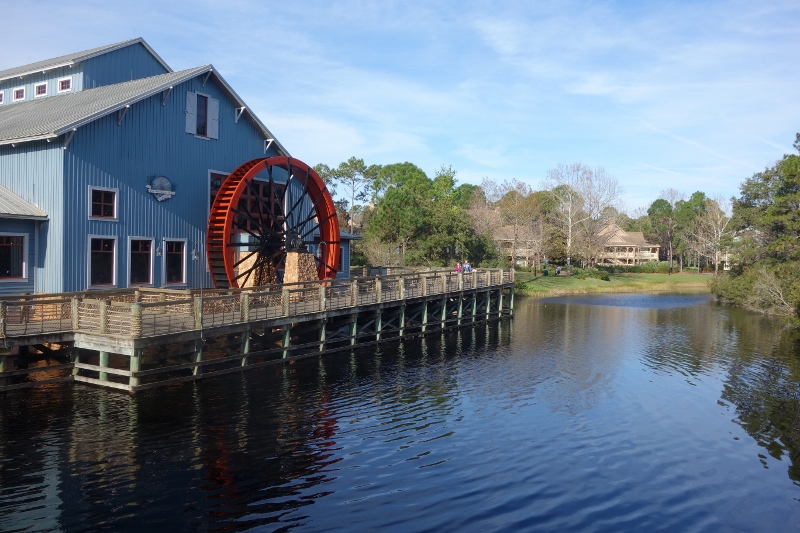
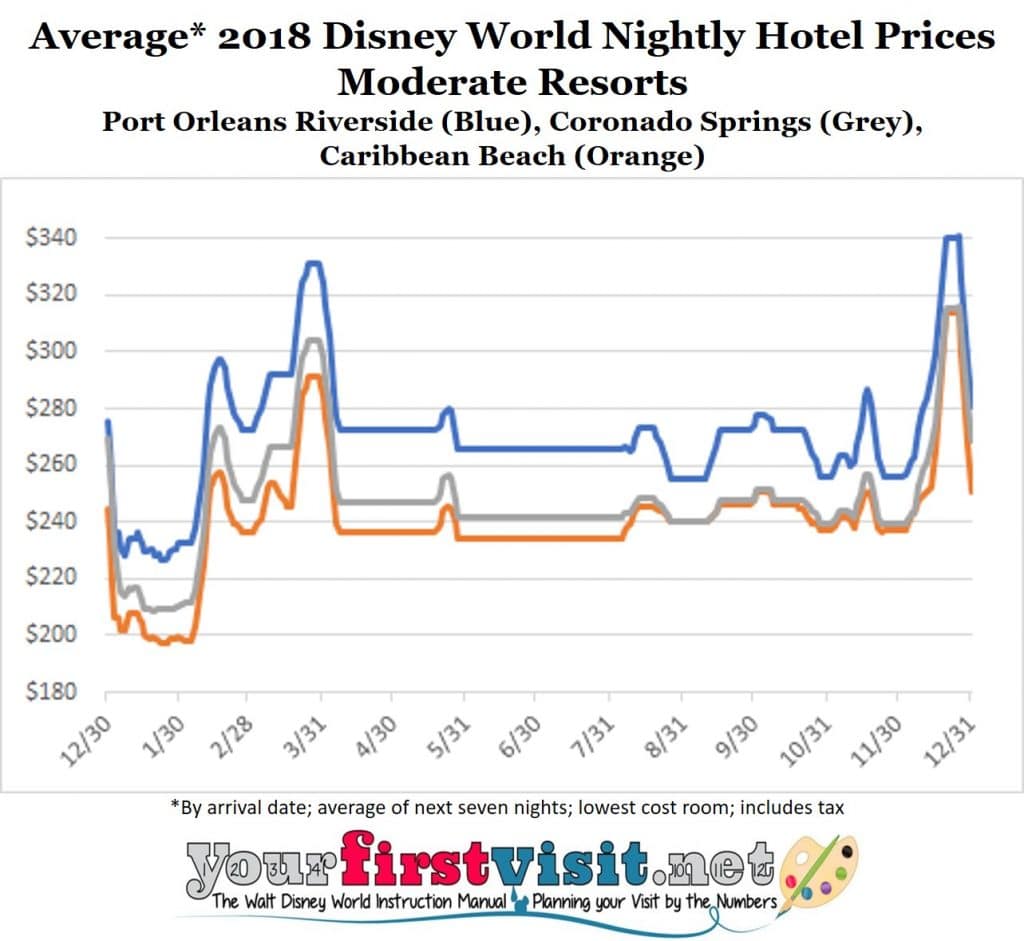
Until 2016, Caribbean Beach, Port Orleans French Quarter, and Port Orleans Riverside standard rooms had the same prices, while Coronado Springs tracked them some nights and other nights was $3-5 more.
In a major change, in 2016 Riverside and French Quarter became the most expensive moderates. This gap widened substantially in 2017, and widens a bit more in 2018.
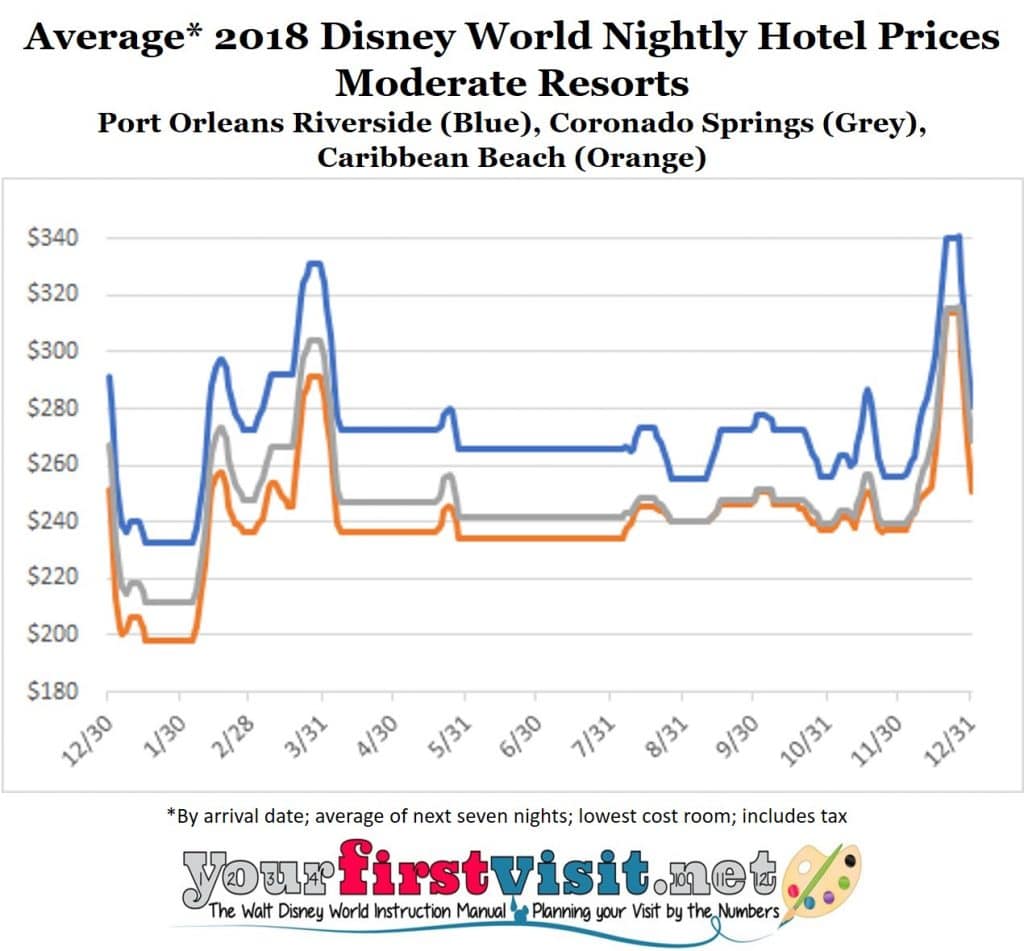
In 2018, standard rooms at the Port Orleans resorts average $23 a night more than Coronado Springs, and most of the year $32/night more than Caribbean Beach. (Caribbean Beach largely returns to prices comparable to Coronado Springs in late 2018.)
Season price increases
Coronado Springs standard rooms show average price increases for 2018 of 5.7%, with the biggest increases in the Value (8.4%) and Fall (7.2%) seasons. Preferred rooms at Coronado Springs are up 4.6% with a range across seasons of 4-5%, except the Easter season, up only 2.8%.
Caribbean Beach prices for 2018 show a fascinating pattern, with almost no increases in any room type (I checked out 5 types) during any of the seasons that launch in the first half of the year, but 4-6% increases in the two seasons that first appear in the second half of the year–the Fall and Holiday seasons. I imagine this pattern is from the refurb/construction that’s happening there, and the pattern–the Fall season opens in late August–gives a suggestion as to when this work will be done.
Prices for Port Orleans French Quarter and Port Orleans Riverside standard rooms, after rocketing up 7-9% across all the major seasons in 2017, see an average increase of 6.4% in 2018, with prices across all major seasons going up 5.5 to 7%. This is higher than the 2018 increases at either Coronado Springs or Caribbean Beach, and thus widens the price differential of the Port Orleans resorts with the other two traditional moderates that we first saw in 2016.
Preferred rooms at Riverside and River View rooms at French Quarter show similar increases.
DISNEY WORLD DELUXE RESORTS PRICING IN 2018
Price season structure
The deluxe resorts run to a different price season calendar than the values and moderates, especially from early July through mid-November.
Their 2018 price season calendar is similar to that of 2017, with the main change being the addition of a few more days of Peak season pricing the week after the Easter season.
The deluxes also see in 2018 the added complexity in day-by-day prices as the values and moderates, but not so much–only for three seasons (Value, Peak, Regular), not four, and typically only for Thursday nights, not the Sundays and Thursdays of the other resort classes.
Price level changes
There’s a bewildering plethora of price points at the deluxes—many view options, with “Club” service options as well. I sampled the full set of price changes in eighteen deluxe room types, and based on that saw no material changes among the overall resort price standings.
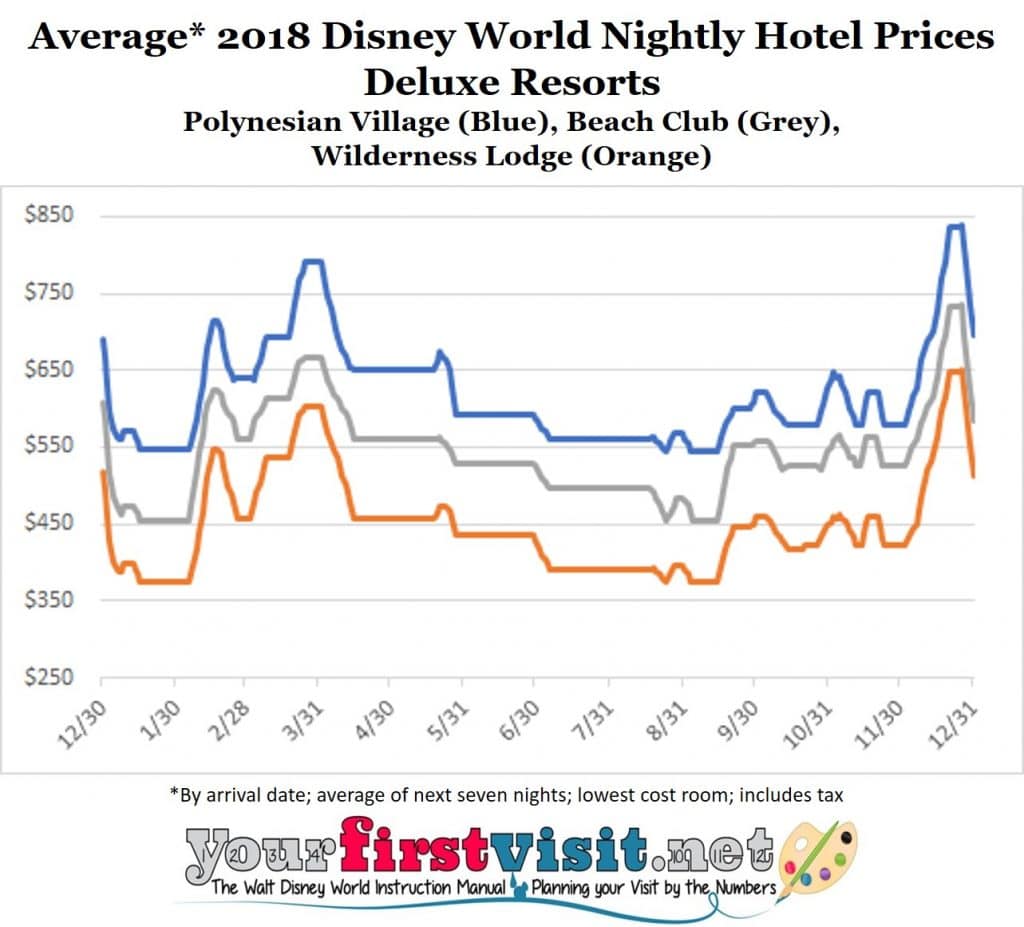
The Grand Floridian is still the most expensive, and standard rooms at the Wilderness Lodge are still largely the least expensive (some seasons, standard view rooms at Animal Kingdom Lodge are cheaper).
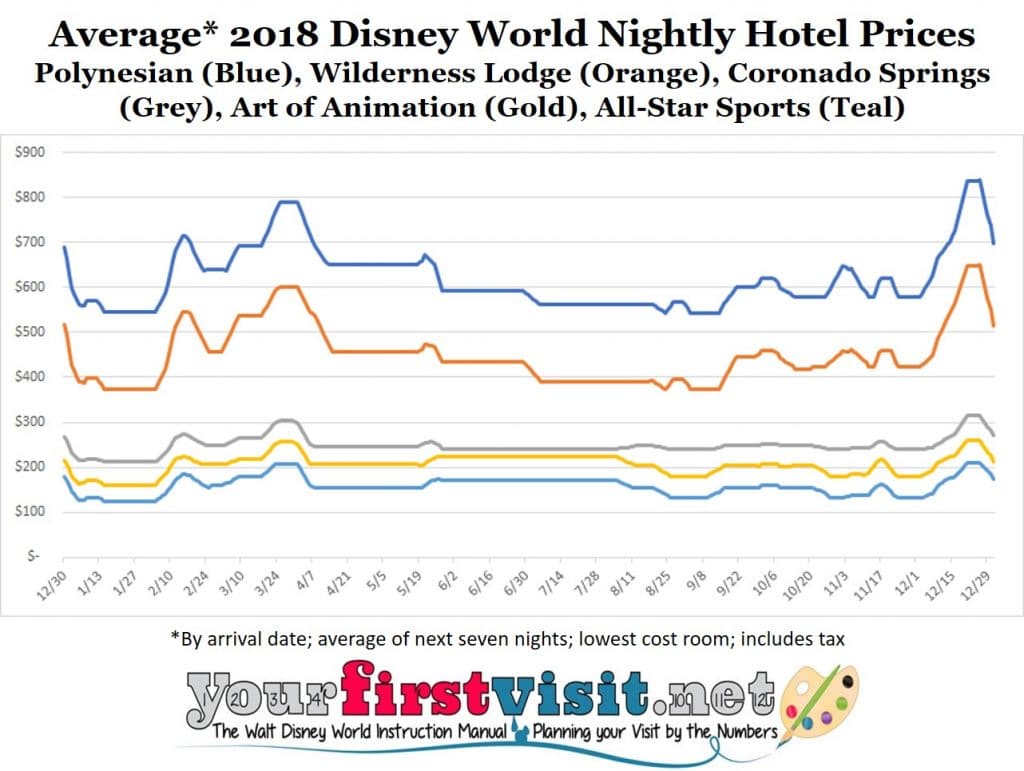
In general, there’s three price groupings among standard deluxe rooms. The three monorail resorts–the Grand Floridian, Polynesian and Contemporary–have the most expensive standard deluxe rooms, the Epcot resorts the Yacht Club, Beach Club, and BoardWalk Inn the next most expensive, and standard rooms at the Animal Kingdom and Wilderness Lodges the least expensive. Price differences vary across the year, but as you can see in the chart above, are on the order of $100/night for each group.
Season price increases
After restrained price increases in 2017, most deluxe rooms are up 5-7% for 2018, with the exception being the Grand Floridian, which for the second year in a row has seen next to no increases.
Polynesian Village standard view room prices were essentially unchanged in 2017, and have gone up 5.1% for 2018. Prices increases are tightly grouped in all principal 2018 seasons except the Regular 2 season, when they go up only 2.6%. Poly lagoon view prices are up 4.2% for 2018, tightly grouped all major seasons except for the Fall season, when they go up just 2.6%.
Contemporary Resort Tower Bay Lake view rooms were unchanged in 2017 in most seasons, and have increased by 5% for 2018. Increases are tightly grouped around 5% except for the Regular 2 season, up 7.1%. Theme Park view Tower rooms here saw 3.4% increases in 2017, and are up 7.4% for 2018. Peak, value and regular season prices all went up more than 8%. Other seasons see increases of 5-7%.
Grand Floridian standard view rooms had an average increase of 1.3% in 2017, and in 2018 have no increase. Two other view types I checked also had no increase for 2018.
Wilderness Lodge standard rooms, after an average 5.4% increase in 2017, are up another 5.9% for 2018. Season increases are tightly in the 5-7% range. Courtyard view rooms here average a 6% increase.
BoardWalk Inn standard view room prices, after being largely unchanged in 2017, are up on average 5.7%, tightly grouped among the seasons with 4.6% to 6.3% increases. Water view rooms here are up 5% and show the same pattern of a narrow range of increases across all 2018 major seasons.
Standard view rooms at the Yacht Club and Beach Club are up for 2018 5.5% on average, grouped among seasons from 4.5% to 6%. The next most expensive room class in each are both up around 5%, also with a tight grouping in price increases for the seasons.
Animal Kingdom Lodge standard room prices are up an average of 6% in 2018 after a 2% rise for 2017. Increases are tightly grouped across the major seasons in the 5-7% range. Savanna view rooms went up about 3% in 2017, and are up 6.2% for 2018.
MORE ON THE DISNEY WORLD RESORTS
I’ve stayed in more than 140 different Disney World-owned rooms, suites, villas, and such. Reviews resulting from these stays are linked to here.


Follow yourfirstvisit.net on Facebook or Twitter or Pinterest!!
July 5, 2017 7 Comments
Disney World 2018 Price Seasons
2018 RESORT PRICE SEASONS AT WALT DISNEY WORLD
The material below shows resort price seasons at Walt Disney World at different times of the year in 2018.
It’s based on material Disney published June 20, 2017, revised–especially January–June 21, and may revise yet again. As my material is based on moving averages and ranges, revisions should much change conclusions you’d draw from it. (For 2017 price seasons, see this.)
Although this may change at the next ticket price increase, currently only one-day ticket prices vary over the course of the year–multi-day tickets do not, although they typically have an annual increase during the year. See this for more on ticket prices.
Resort prices, however, can be almost twice as high during some periods as they are at others.
 In the material below, “X% Higher” means compared to the lowest prices of the year.
In addition to the detailed forecasts presented below, Disney ups prices even more during certain weekends and holidays–particularly over the Martin Luther King Day weekend, President’s Day weekend, Memorial Day weekend, Columbus Day weekend, and Veterans Day weekend.
The images give an overview of the year, with specifics in the lists.

2018 DISNEY WORLD PRICE SEASONS: VALUE RESORTS
- 40-50% higher–the peak season–begins 1/1/2018
- Lowest of year–the value season–begins 1/2/18
- 20-30% higher–Marathon rates–begin 1/3/18
- Lowest of year–the value season–begins 1/7/18
- 25-30% higher–the regular season-begins 2/11/18
- 40-50% higher–the peak season–begins 2/15/18
- 25-30% higher–the regular season–begins 2/25/18
- 40-50% higher–the peak season–begins 3/9/18
- 65-70% higher–the Easter season–begins 3/25/18
- 25-30% higher–the regular season–begins 4/8/18
- 35-40% higher–the summer season–begins 5/25/18
- 25-30% higher–the regular season–begins 8/12/18
- 10-15% higher–the fall season–begins 8/26/18
- 25-30% higher–the regular season–begins 9/16/18
- 10-15% higher–the fall season– begins 10/28/18
- 30-40% higher over Thanksgiving begins 11/17/18
- 10-15% higher–the fall season—begins 11/24/18
- 25-30% higher–the regular season–begins 12/9/18
- 40-50% higher–the peak season–begins 12/14/18
- 65-80% higher–the holiday season–begins 12/21/18
 2018 DISNEY WORLD PRICE SEASONS: DELUXE RESORTS

- 30-45% higher–the peak season–begins 1/1/18
- Lowest of year–the value season–begins 1/3/18
- 15-25% higher–Marathon rates–begins 1/4/18
- Lowest of year–the value season–begins 1/7/18
- 20-25% higher–the regular season–begins 2/11/18
- 30-45% higher–the peak season–begins 2/15/18
- 20-25% higher–the regular season–begins 2/25/18
- 30-45% higher–the peak season–begins 3/9/18
- 50-65% higher–the Easter season–begins 3/25/18
- 30-45% higher–the peak season–begins 4/8/18

- 20-25% higher–the regular season–begins 4/15/18
- 10-20% higher–the summer season–begins 5/25/18
- 5-10% higher—near-lowest of year–the value season 2–begins 7/6/18
- Lowest of year–the value season—begins 8/24/18
- 10-25% higher–the regular season 2–begins 9/21/18
- 10-20% higher–the fall season–begins 10/14/18
- 20-25% higher–the regular season–begins 11/2/18
- 10-20% higher–the fall season–begins 11/12/18
- 25-40% higher during Thanksgiving begins 11/20/18
- 10-20% higher–the fall season–begins 11/24/18
- 20-25% higher–the regular season–beings 12/9/18
- 30-45% higher–the peak season–begins 12/14/18
- 55-75% higher–the holiday season–begins 12/21/18
2018 DISNEY WORLD PRICE SEASONS: MODERATE RESORTS

- 25-30% higher–the peak season–begins 1/1/18
- Lowest of year–the value season—begins 1/3/18
- 10-15% higher–Marathon rates–begins 1/4/18
- Lowest of year–the value season—begins 1/7/18
- 15-20% higher–the regular season-begins 2/11/18
- 25-30% higher–the peak season–begins 2/15/18
- 15-20% higher–the regular season-begins 2/25/18
- 25-30% higher–the peak season–begins 3/9/18
- 45-50% higher–the Easter season–begins 3/25/18
- 15-20% higher–the regular season–begins 4/8/18
- 15-20% higher–the summer season–begins 5/25/18
- 15-20% higher–the regular season–begins 8/12/18
- 15-20% higher–the fall season–begins 8/26/18
- 15-20% higher–the regular season–begins 9/16/18
- 15-20% higher–the fall season–begins 10/28/18
- 20-25% higher over Thanksgiving begins 11/17/18
- 15-20% higher–the fall season—begins 11/24/18
- 15-20% higher–the regular season–beings 12/9/18
- 25-30% higher–the peak season–begins 12/14/18
- 50-60% higher–the holiday season–begins 12/21/18
Follow yourfirstvisit.net on Facebook or Google+ or Twitter or Pinterest!!
October 25, 2016 23 Comments
Updated Planning Tools for Disney World in 2017
Over the past couple of weeks, I’ve updated my key planning tools for a 2017 visit to Walt Disney World:

(Kelly B can book your 2017 Disney World vacation for you–contact her at KellyB@DestinationsInFlorida.com or 980-429-4499.)
The price season update was based on Disney’s actual price calendar for 2017, published June 21.
The crowd calendar update was based on analysis of the 2016-2017 school year breaks of more than 15.4 million school kids–see this for an example. I analyzed for 2017 almost 280 districts, and too many of these don’t finalize their calendars until June–late June in the case of many Michigan districts, which go on spring break April 1 in 2017…
And the week rankings were revised because actual prices and updated crowd forecasts are major components in their design–with other important factors being as always ride closures, the peak of the hurricane season, and the Disney World holiday program.
After major price season changes in 2016, structural changes to the seasons on 2017 were minor–although the changes in 2017 price levels are interesting. So my forecasts largely held up, and the only week that saw a material change from the actual prices was the week beginning 4/22. It sees lower prices at the beginning of the week than I’d forecast, and moved as a result in the week rankings from #12 to #9.
Crowd rankings saw several significant changes.
- Because Christmas breaks extend longer into January than I’d thought they would, the first week of January 2017 saw an increase in expected crowds.
- Disney World’s recent announcement of its involvement in the 2017 Pro Bowl caused me to increase expected crowds in later January.
- And actual 2017 spring break calendars suggest that crowds the week of April 1, 2017 will be higher than I had last forecast.
The most significant change to week rankings from changes in the crowd calendar came for the week beginning 4/1, which moved from a ranking of 14 at the bottom of my list of recommended weeks to a week ranking of 19 near the bottom of my “not so keen” weeks.
As always, I’m sorry about where I got it wrong–especially the week of 4/1. I get one week so substantively wrong every two years or so, and almost always in the spring break seasons, where the moving date of Easter cause a cascade of other effects, not all predictable even though I’ve been doing this for a while now.
But the alternative, delaying any forecasts for the next year until July, when the full set of school calendars and (usually) prices is available–also seems to me a mistake as well, since there’s so much value to being able to plan your trips ahead of time…

Follow yourfirstvisit.net on Facebook or Twitter or Pinterest!!
July 4, 2016 No Comments
Disney World 2017 Price Seasons
2017 RESORT PRICE SEASONS AT WALT DISNEY WORLD

The material below shows resort price seasons at Walt Disney World at different times of the year in 2017.
(For 2018 Disney World resort prices, see this, and for 2019 Disney World resort prices, see this.)
Although this may change at the next ticket price increase, currently only one-day ticket prices vary over the course of the year–multi-day tickets do not, although they typically have an annual increase during the year. See this for more on ticket prices.
Resort prices, however, can be almost twice as high during some periods as they are at others.
In the material below, “X% Higher” means compared to the lowest prices of the year.
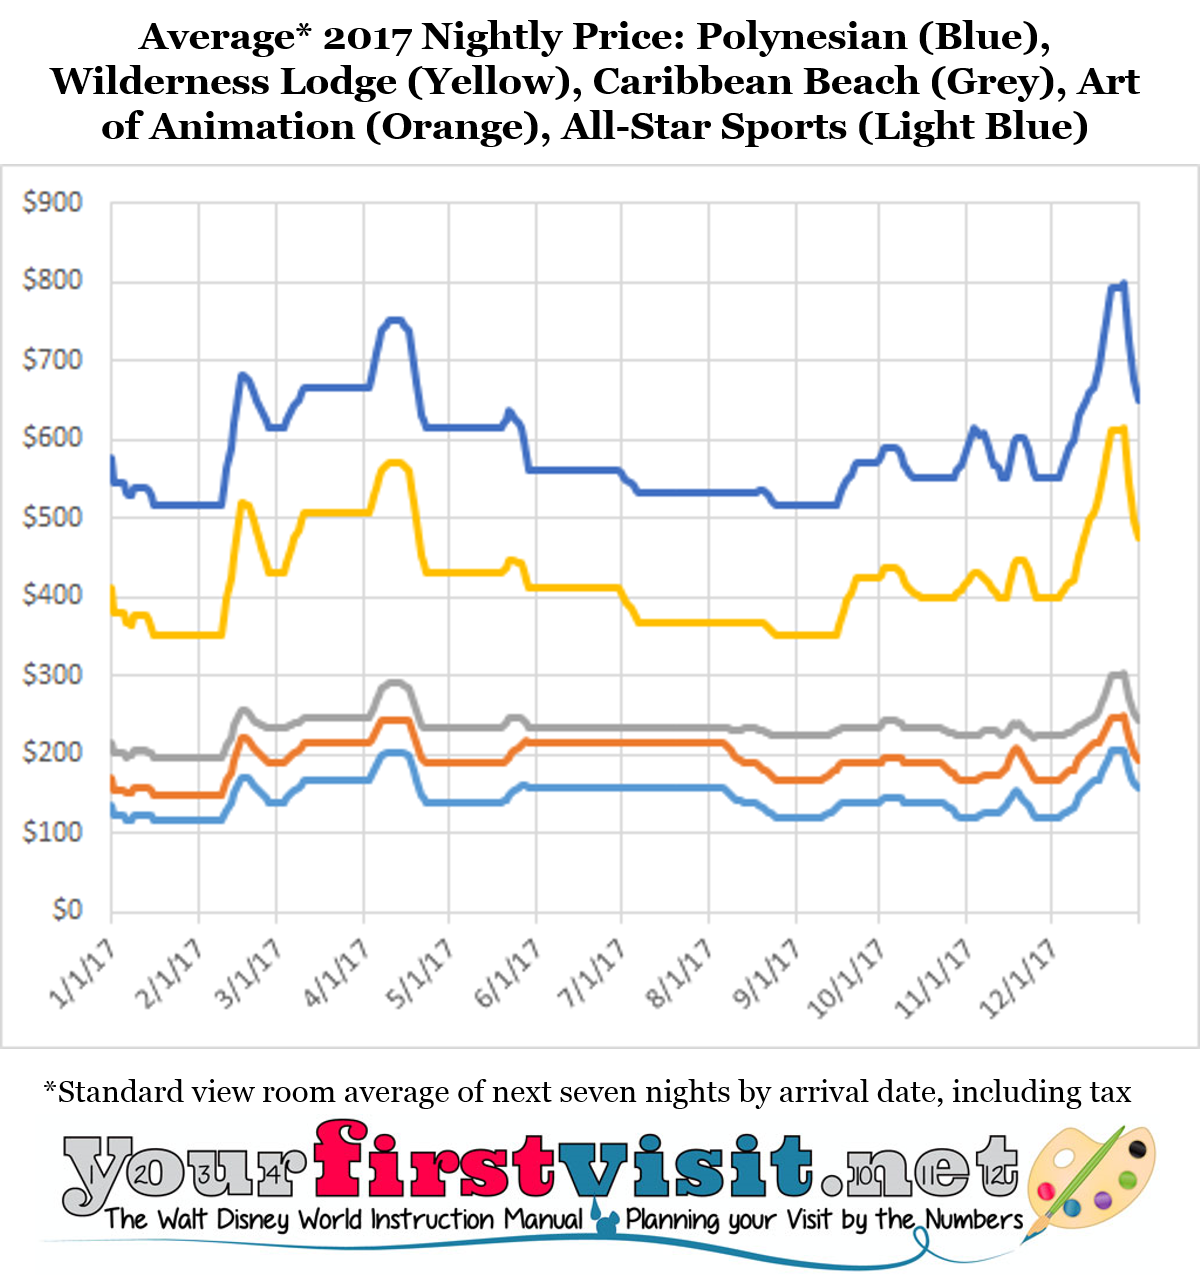
The image gives an overview of the year, with specifics in the lists that follow.
In addition to the details presented below, Disney ups prices even more during certain weekends and holidays–particularly over the Marathon weekend, Martin Luther King Day weekend, President’s Day weekend, Memorial Day weekend, Columbus Day weekend, and Veterans Day weekend.
2017 DISNEY WORLD PRICE SEASONS: VALUE RESORTS
- 40-45% higher–the peak season–begins 1/1/2017
- Lowest of year–the value season—begins 1/2/17
- 40-45% higher–the peak season–begins 2/16/17
- 20-25% higher–the regular season-begins 2/26/17
- 40-45% higher–the peak season–begins 3/10/17
- 55-75% higher–the Easter season–begins 4/9/17
- 40-45% higher–the peak season–begins 4/21/17
- 20-25% higher–the regular season–begins 4/23/17
- 30-45% higher–the summer season–begins 5/26/17
- 20-25% higher–the regular season–begins 8/13/17
- 5-10% higher–the fall season–begins 8/25/17
- 20-25% higher–the regular season–begins 9/17/17
- 5-10% higher–the fall season– begins 10/29/17
- 20-40% higher over Thanksgiving begins 11/18/17
- 5-10% higher–the fall season—begins 11/25/17
- 20-25% higher–the regular season–begins 12/10/17
- 40-45% higher–the peak season–begins 12/15/17
- 60-75% higher–the holiday season–begins 12/22/17
2017 DISNEY WORLD PRICE SEASONS: DELUXE RESORTS
- 25-35% higher–the peak season–begins 1/1/17
- Lowest of year–the value season—begins 1/2/17
- 25-35% higher–the peak season–begins 2/16/17
- 15-20% higher–the regular season–begins 2/26/17
- 25-35% higher–the peak season–begins 3/10/17
- 35-55% higher–the Easter season–begins 4/9/17
- 25-35% higher–the peak season–begins 4/21/17
- 15-20% higher–the regular season–begins 4/23/17
- 10% higher–the summer season–begins 5/26/17
- 0-5% higher–near-lowest of year–the value season 2—begins 7/7/17
- Lowest of year–the value season—begins 8/25/17
- 5-20% higher–the regular season 2–begins 9/22/17
- 5-15% higher–the fall season–begins 10/15/17
- 15-20% higher–the regular season–begins 11/3/17
- 5-15% higher–the fall season–begins 11/13/17
- 20-25% higher during Thanksgiving begins 11/21/17
- 5-15% higher–the fall season–begins 11/25/17
- 20% higher–the regular season–beings 12/10/17
- 25-35% higher–the peak season–begins 12/15/17
- 40-60% higher–the holiday season–begins 12/22/17
2017 DISNEY WORLD PRICE SEASONS: MODERATE RESORTS
- 20-25% higher–the peak season–begins 1/1/17
- Lowest of year–the value season—begins 1/2/17
- 20-25% higher–the peak season–begins 2/16/17
- 15-20% higher–the regular season-begins 2/26/17
- 20-25% higher–the peak season–begins 3/10/17
- 45-50% higher–the Easter season–begins 4/9/17
- 20-25% higher–the peak season–begins 4/21/17
- 15-20% higher–the regular season–begins 4/23/17
- 15-20% higher–the summer season–begins 5/26/17
- 15-20% higher–the regular season–begins 8/13/17
- 10-15% higher–the fall season–begins 8/25/17
- 15-20% higher–the regular season–begins 9/17/17
- 10-15% higher–the fall season–begins 10/29/17
- 20-25% higher over Thanksgiving begins 11/18/17
- 10-15% higher–the fall season—begins 11/25/17
- 15-20% higher–the regular season–beings 12/10
- 20-25% higher–the peak season–begins 12/15/17
- 50-55% higher–the holiday season–begins 12/22/17
Follow yourfirstvisit.net on Facebook or Twitter or Pinterest!!
September 27, 2015 31 Comments
Disney World 2016 Price Seasons
2016 RESORT PRICE SEASONS AT WALT DISNEY WORLD
 The material below shows resort price seasons at Walt Disney World at different times of the year in 2016.
(For 2017 prices, see this, and for 2018 prices, see this.)
Only one-day ticket prices vary over the course of the year–multi-day tickets do not, although they typically have an annual increase during the year. See this for more on ticket prices.
Resort prices, however, can be almost twice as high during some periods as they are at others.
2016 DISNEY WORLD PRICE SEASONS
Below are Walt Disney World 2016 resort price seasons by resort type.
“X% Higher” means compared to the lowest prices of the year. Because these increases are different on some weekends vs. weekdays, increases are averaged across the recommended 8 night visit.
In addition to the details below, Disney ups prices an additional $10-50 per night during certain weekends and holidays–particularly over the Marathon weekend, Martin Luther King Day weekend, Memorial Day weekend, 4th of July weekend, and Columbus Day weekend.
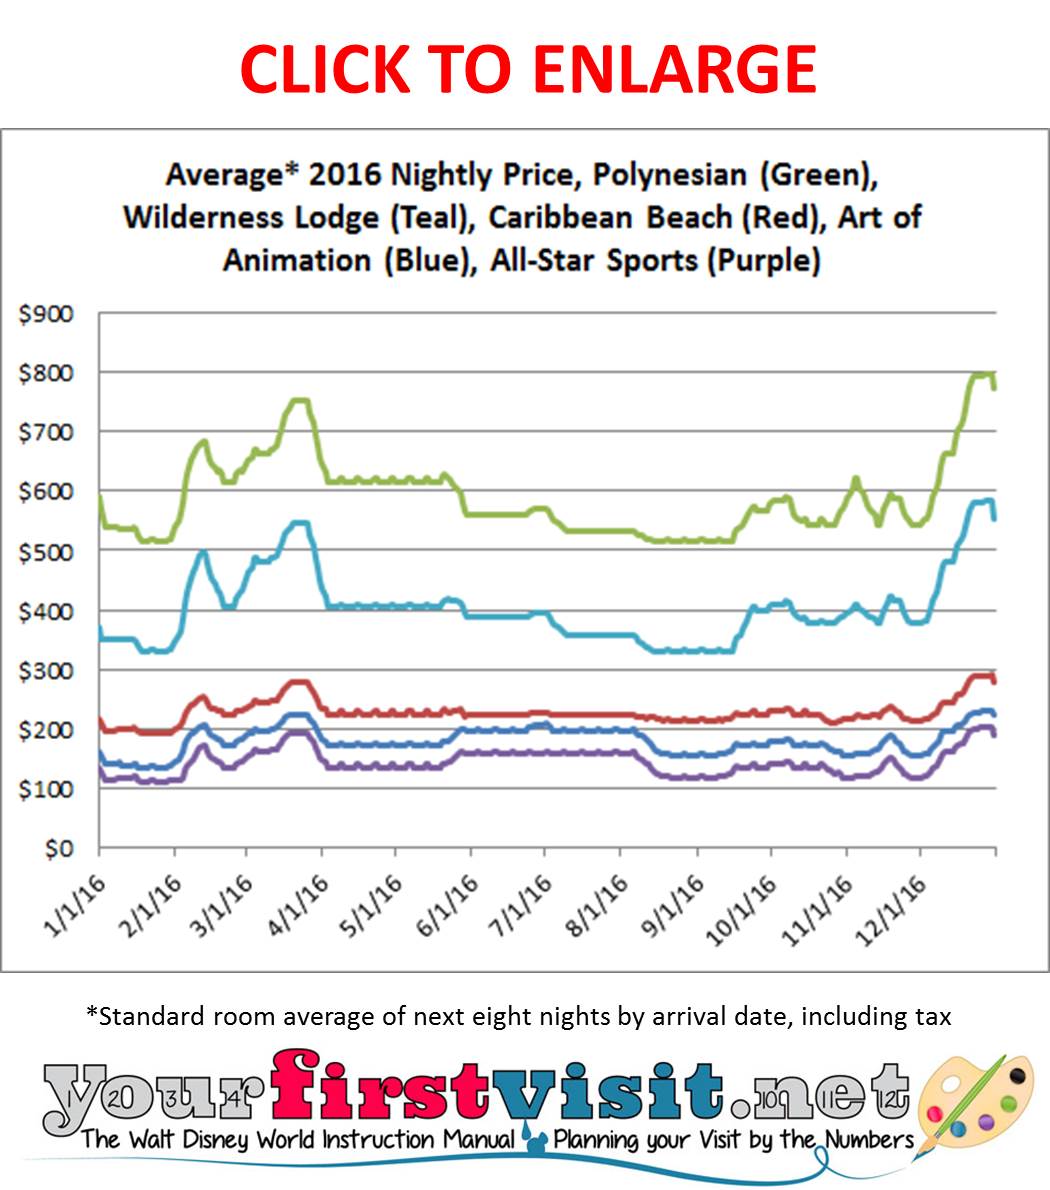 You can see–well, maybe you can see–the full prices over the year from the chart above.
2016 DISNEY WORLD PRICE SEASONS: VALUE RESORTS
- Lowest of year–the value season—begins 1/3/16
- 25% higher–the regular season-begins 2/7/16
- 45% higher–the peak season–begins 2/11/16
- 25% higher–the regular season-begins 2/21/16
- 45% higher–the peak season–begins 3/4/16
- 60% higher–the Easter season–begins 3/20/16
- 25% higher–the regular season–begins 4/3/16
- 45% higher–the summer season–begins 5/27/16
- 25% higher–the regular season–begins 8/14/16
- 10% higher–the fall season–begins 8/19/16
- 25% higher–the regular season–begins 9/18/16
- 10% higher–the fall season– begins 10/30/16
- 50% higher over Thanksgiving begins 11/19/16
- 10% higher–the fall season—begins 11/26/16
- 45% higher–the peak season–begins 12/11/16
- 65% higher–the holiday season–begins 12/22/16
2016 DISNEY WORLD PRICE SEASONS: DELUXE RESORTS
- Lowest of year–the value season—begins 1/3/16
- 20% higher–the regular season–begins 2/7/16
- 30% higher–the peak season–begins 2/11/16
- 20% higher–the regular season–begins 2/21/16
- 30% higher–the peak season–begins 3/4/16
- 45% higher–the Easter season–begins 3/20/16
- 20% higher–the regular season–begins 4/3/16
- 10% higher–the summer season–begins 5/27/16
- 3% higher–near-lowest of year–the value season 2—begins 7/10/16
- Lowest of year–the value season—begins 8/14/16
- 12% higher–the regular season 2–begins 9/23/16
- 6% higher–the fall season–begins 10/16/16
- 20% higher–the regular season–begins 11/4/16
- 6% higher–the fall season–begins 11/13/16
- 20% higher during Thanksgiving begins 11/22/16
- 6% higher–the fall season, with low prices, begins 11/26/16
- 30% higher–the peak season–begins 12/11/16
- 55% higher–the holiday season–begins 12/22/16
2016 DISNEY WORLD PRICE SEASONS: MODERATE RESORTS
- Lowest of year–the value season—begins 1/3/16
- 20% higher–the regular season-begins 2/7/16
- 25% higher–the peak season–begins 2/11/16
- 20% higher–the regular season-begins 2/21/16
- 25% higher–the peak season–begins 3/4/16
- 45% higher–the Easter season–begins 3/20/16
- 20% higher–the regular season–begins 4/3/16
- 15% higher–the summer season–begins 5/27/16
- 20% higher–the regular season–begins 8/14/16
- 10% higher–the fall season–begins 8/19/16
- 20% higher–the regular season–begins 9/18/16
- 10% higher–the fall season–begins 10/30/16
- 50% higher over Thanksgiving begins 11/19/16
- 10% higher–the fall season—begins 11/26/16
- 25% higher–the peak season–begins 12/11/16
- 50% higher–the holiday season–begins 12/22/16
Follow yourfirstvisit.net on Facebook or Google+ or Twitter or Pinterest!!
September 24, 2014 34 Comments
Disney World 2015 Price Seasons
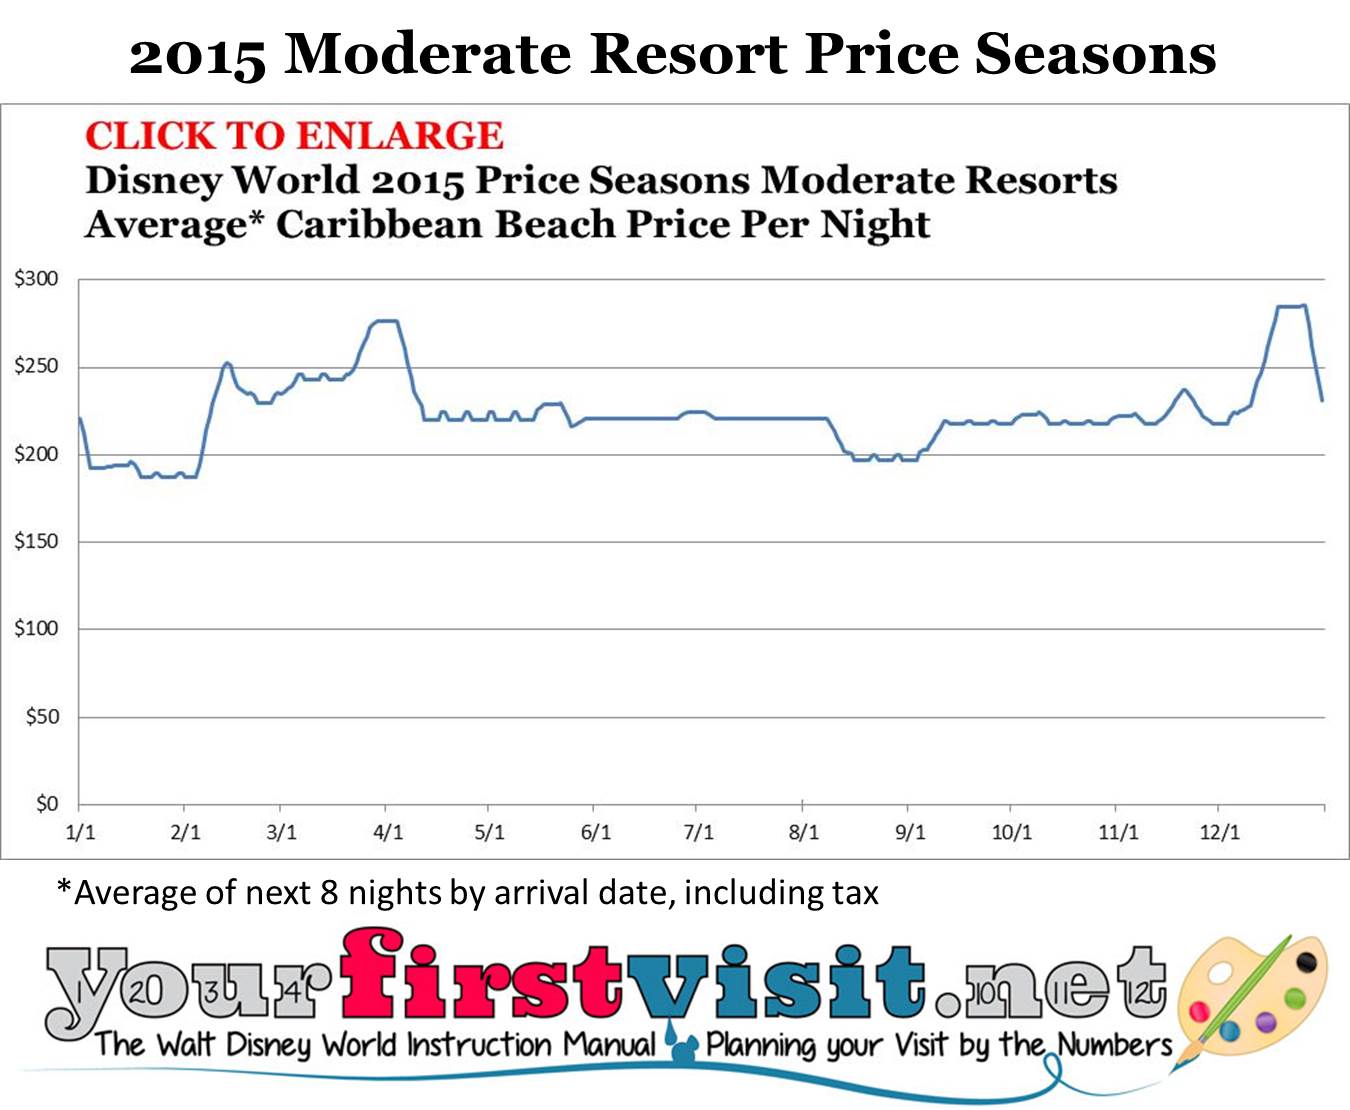
2015 RESORT PRICE SEASONS AT WALT DISNEY WORLD
 The material below shows resort price seasons at Walt Disney World at different times of the year in 2015.
(For 2016 prices, see this, and 2017 prices, this)
Ticket prices don’t vary over the course of the year–although they typically have an annual increase during the year. See this for more on ticket prices.
Resort prices, however, are almost twice as high during some periods as they are at others.
2015 DISNEY WORLD PRICE SEASONS
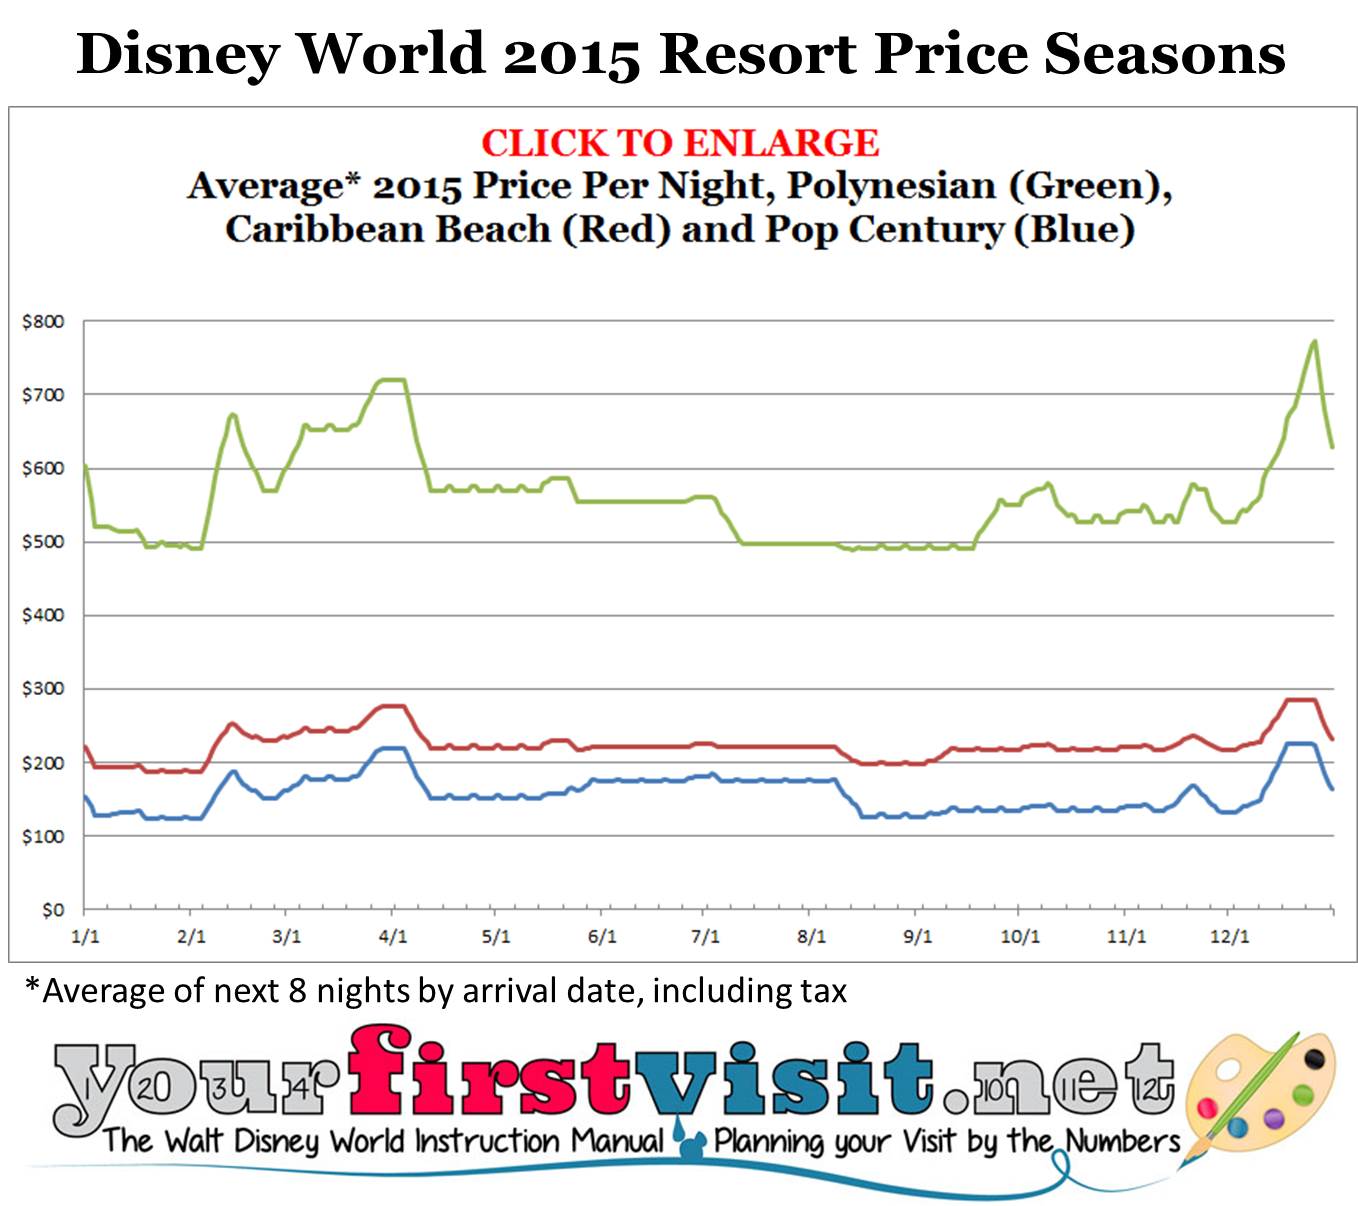
Below are Walt Disney World 2015 resort price seasons by resort type. Value prices are based on Pop Century, moderates on Caribbean Beach, and deluxes on the Polynesian.
“X% Higher” means compared to the lowest prices of the year. Because these increases are different on some weekends vs. weekdays, increases are averaged across the recommended 8 night visit.
In addition to the below, Disney ups prices an additional $10-50 per night during certain weekends and holidays–particularly over the Marathon weekend, Martin Luther King Day weekend, Memorial Day weekend, 4th of July weekend, and Columbus Day weekend.
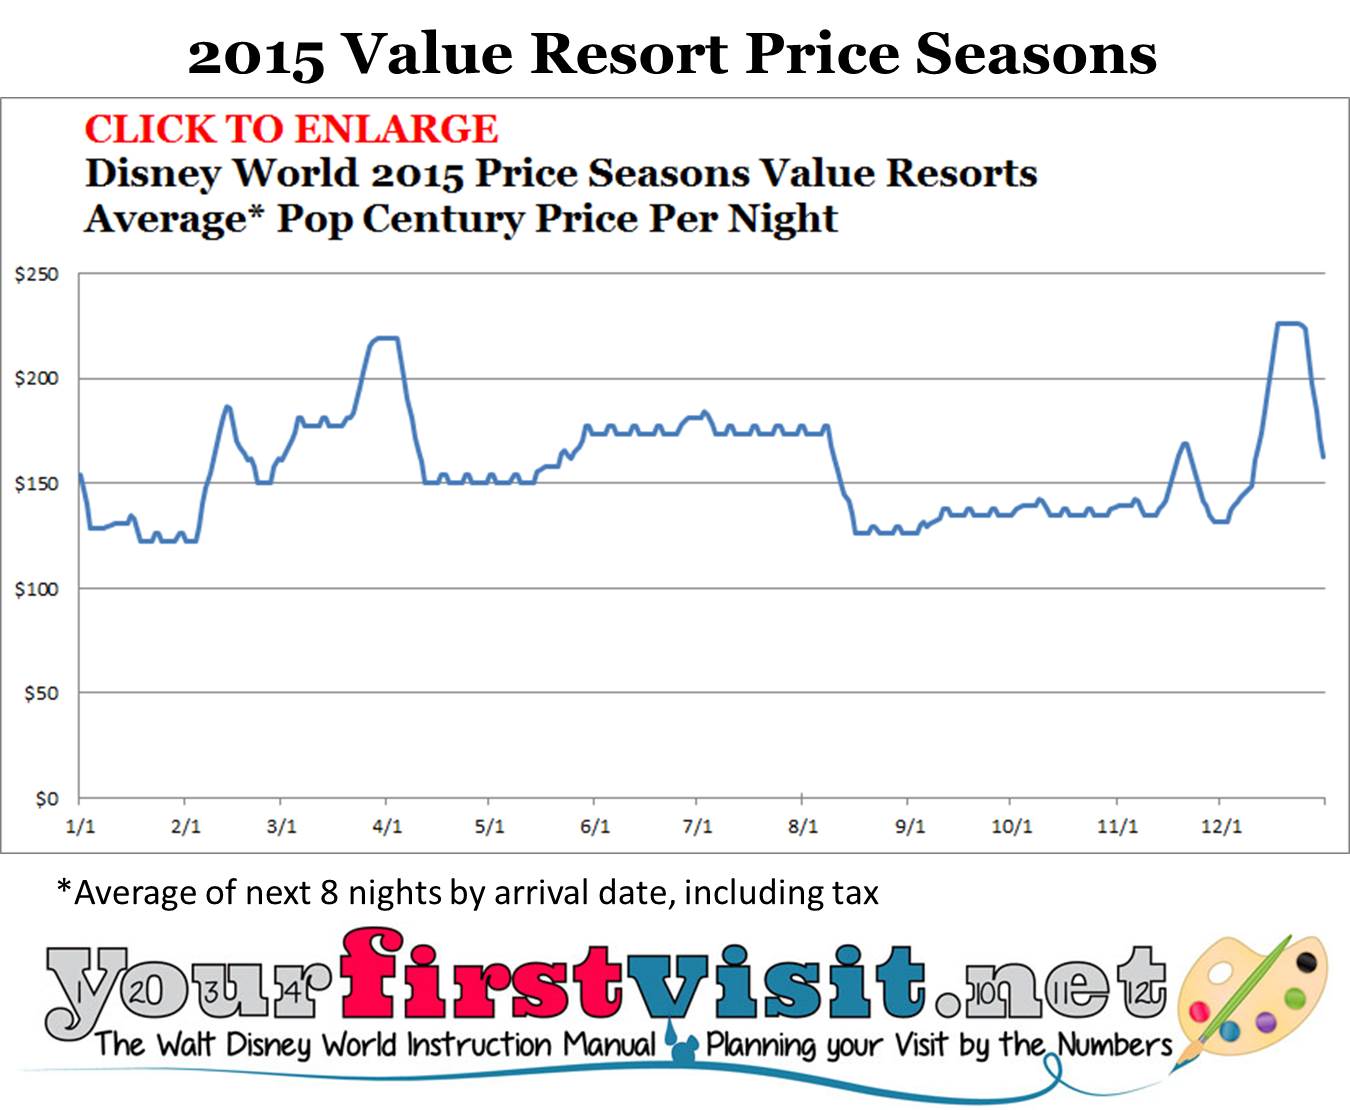
2015 DISNEY WORLD PRICE SEASONS: VALUE RESORTS
- Lowest of year–the value season—begins 1/4/15
- 45% higher–the peak season–begins 2/12/15
- 25% higher–the regular season-begins 2/22/15
- 45% higher–the peak season–begins 3/6/15
- 75% higher–the Easter season–begins 3/29/15
- 25% higher–the regular season–begins 4/12/15
- 45% higher–the summer season–begins 5/29/15
- 5% higher–near lowest of year–the value season 2—begins 8/16/15
- 10% higher–the fall season, with low prices, begins 9/11/15
- 50% higher over Thanksgiving begins 11/21/15
- 10% higher–the fall season, with low prices, begins 11/28/15
- 45% higher–the peak season–begins 12/11/15
- 80% higher–the holiday season–begins 12/18/15
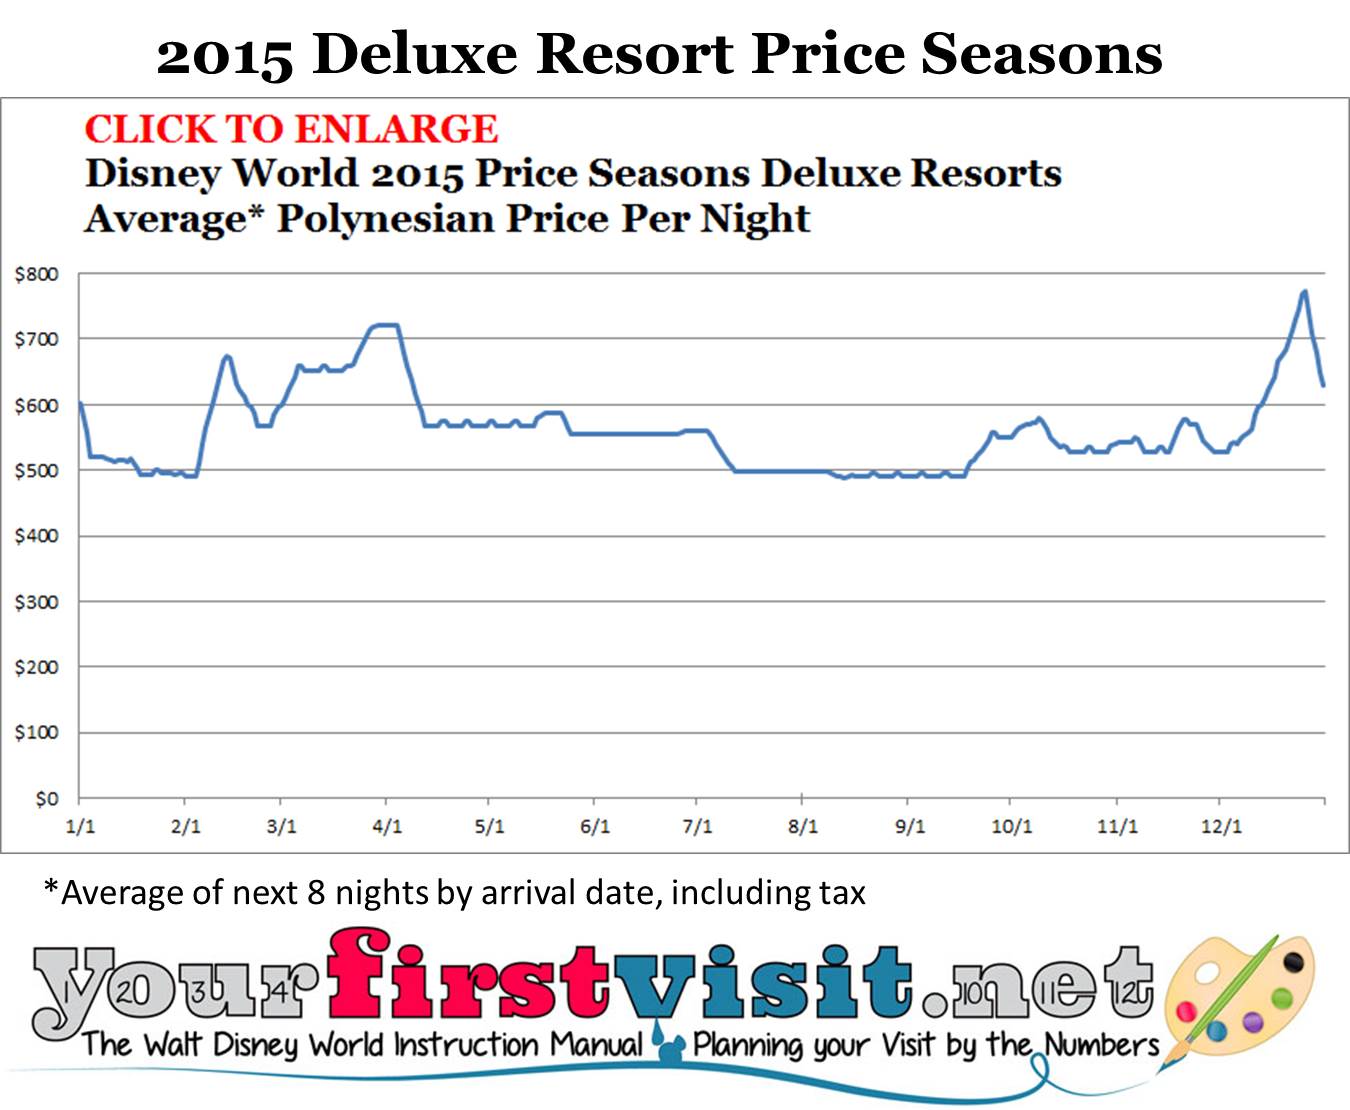
2015 DISNEY WORLD PRICE SEASONS: DELUXE RESORTS
- Lowest of year–the value season—begins 1/4/15
- 33% higher–the peak season–begins 2/12/15
- 16% higher–the regular season–begins 2/22/15
- 33% higher–the peak season–begins 3/6/15
- 45% higher–the Easter season–begins 3/29/15
- 16% higher–the regular season–begins 4/12/15
- 12% higher–the summer season–begins 5/29/15
- 1% higher–near-lowest of year–the value season 2—begins 7/12/15
- Lowest of year–the value season—begins 8/16/15
- 12% higher–the regular season 2–begins 9/25/15
- 10% higher–the fall season, with low prices, begins 10/18/15
- 25% higher during Thanksgiving begins 11/24
- 8% higher–the fall season, with low prices, begins 11/28/15
- 16% higher–the regular season–begins 12/11/15
- 33% higher–the peak season–begins 12/18/15
- 55% higher–the holiday season–begins 12/25/15
2015 DISNEY WORLD PRICE SEASONS: MODERATE RESORTS
- Lowest of year–the value season—begins 1/4/15
- 30% higher–the peak season–begins 2/12/15
- 20% higher–the regular season-begins 2/22/15
- 30% higher–the peak season–begins 3/6/15
- 45% higher–the Easter season–begins 3/29/15
- 20% higher–the regular season–begins 4/12/15
- 15% higher–the summer season–begins 5/29/15
- 5% higher–near lowest of year–the value season 2—begins 8/16/15
- 8% higher–The fall season, with low prices, begins 9/11/15
- 30% higher for Thanksgiving begins 11/21/15
- 8% higher–The fall season, with low prices, begins 11/28/15
- 30% higher–the peak season–begins 12/11/15
- 50% higher–the holiday season–begins 12/18/15
MORE ON WHEN TO GO TO WALT DISNEY WORLD
- For when to go to Walt Disney World, see this
- For the best and worst times to visit, see this
- For forecasting crowds at Walt Disney World, see this
- For the 2015 Crowd Calendar, click here
- For the 2016 Crowd Calendar, click here
- For seasonal pricing at Walt Disney World, see this
- For 2015 price seasons, see this
- For projected 2016 price seasons, see this
- For weather at Walt Disney World, see this
Want a second opinion? Then check out my book lol.
Follow yourfirstvisit.net on Facebook or Google+ or Twitter or Pinterest!!
October 13, 2013 156 Comments