
Category — Disney World Price Seasons
2023 Disney World Resort Hotel Prices
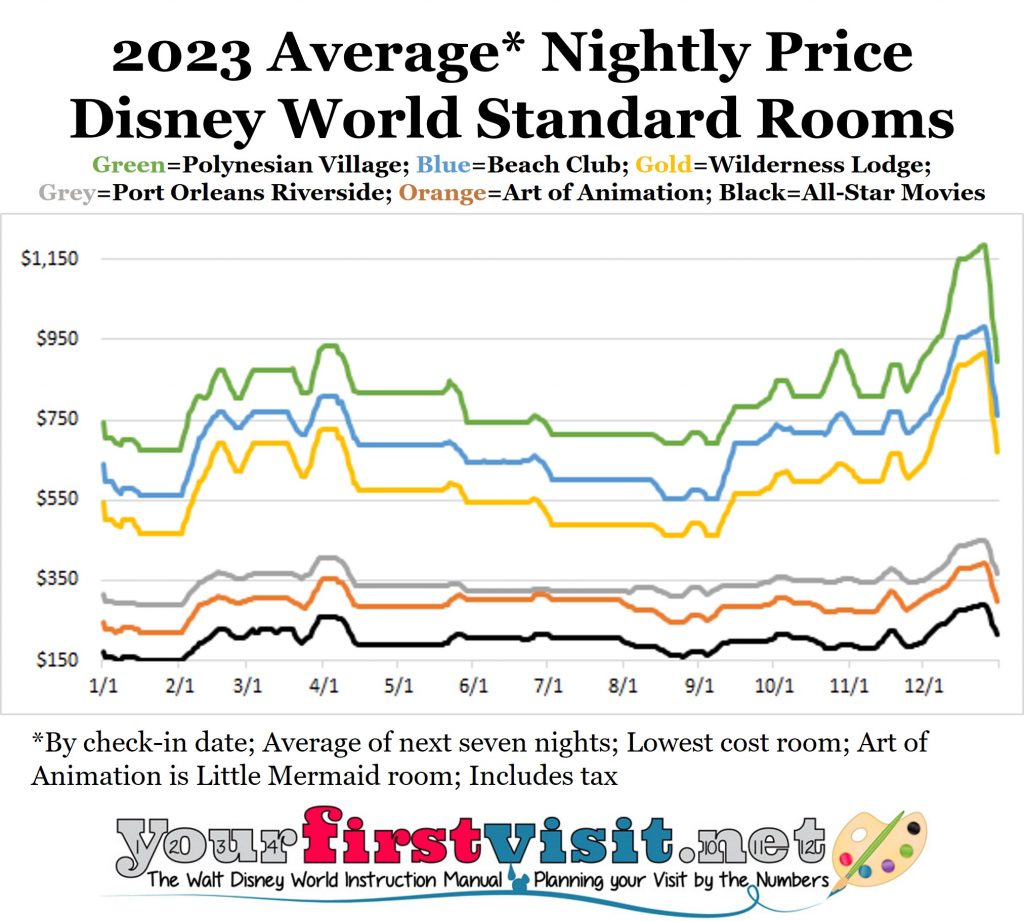
2023 RESORT HOTEL PRICE SEASONS AT WALT DISNEY WORLD
The material below shows Walt Disney World resort hotel price seasons at different times of the year in 2023.
Resort prices can be almost twice as high during some periods as they are at others. The information on this page helps you identify lower and higher cost periods.
Ticket prices also vary by date. Much of the time, you’ll find higher ticket prices when resort hotel prices are also higher, but there are nuances to this, as the hotel market is more competitive, and for deluxes in particular, is affected by both the tourist and convention markets. I’ll be publishing similar material on 2023 Disney World ticket prices shortly.
In the below, I compare 2023 hotel prices over the year for each hotel class to that class’s lowest price of 2023, its “value season” in parts of January and February.
Grouping of dates is based on “price seasons,” a grouping tool Disney World no longer makes public, but which can be identified analytically, and named (sorta) based on past practices. Disney charges based on the actual price of the actual nights, so if your visit straddles price seasons, you’ll pay the prices of each price season.
The charts average prices over the next seven nights, by arrival date. This eliminates what would be otherwise be incomprehensible bumpiness from Thursday/Sunday and/or Friday/Saturday upcharges. For exact prices by night by room type by date, see MouseSavers.com.
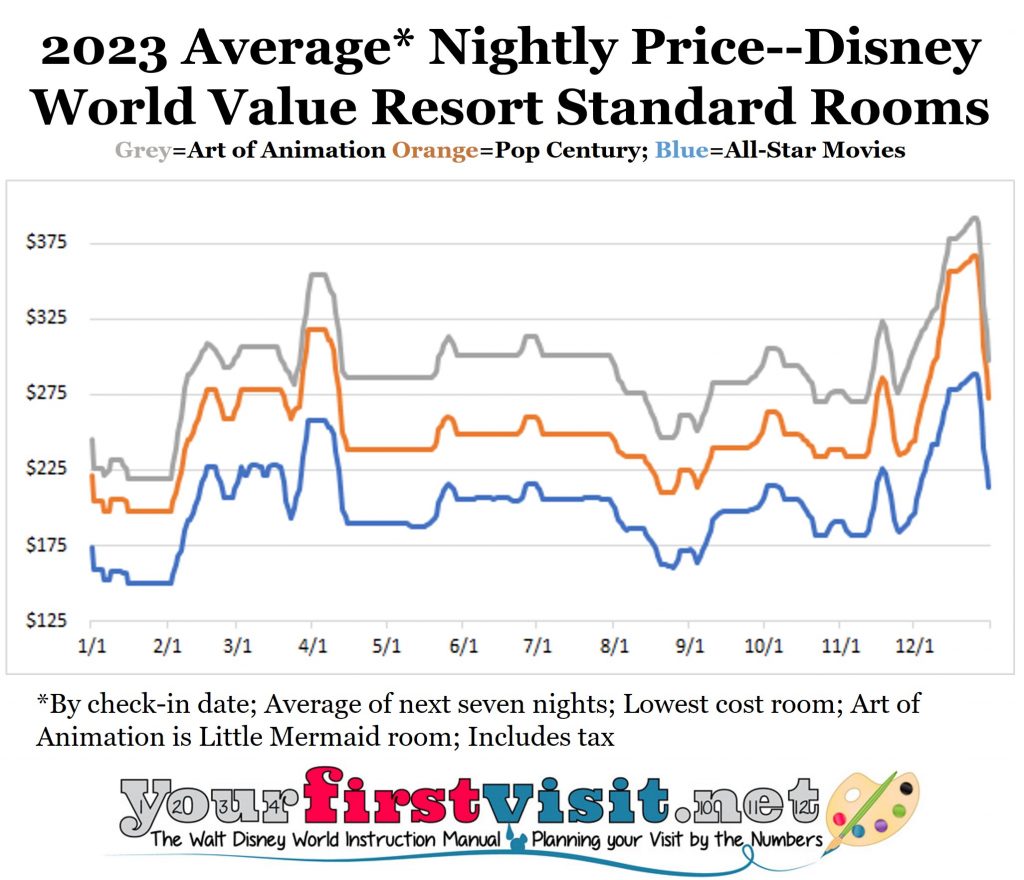
2023 DISNEY WORLD RESORT PRICE SEASONS: VALUE RESORTS
The lowest prices of the year–the value season–1/2 through 2/8/2023, except:
- January 5-7– 15-30% higher from RunDisney event than lowest of the year
- January 13-15– 20-30% higher for MLK holiday weekend than lowest of the year
Regular season prices 2/9 through 2/16 25-30% higher than the lowest of the year
Presidents Day holiday prices 2/17 and 2/18 55% to 70% higher than lowest of the year
Spring season prices 2/29 through 2/26 40-50% higher
Regular season prices 2/27 through 3/2 25-30% higher
Spring season prices 3/3 through 3/25 40-50% higher
Regular season prices 3/26 through 3/29 25-30% higher
Easter holiday prices 3/30 through 4/12 60-70% higher
Spring season prices 4/13 and 4/14 40-50% higher
Regular 2 season prices 4/15 through 5/25 20-30% higher
Memorial Day holiday prices 5/26 through 5/28 50-60% higher
Summer season prices 5/29 through 8/5 25-40% higher except
- 4th of July holiday prices 50-60% higher June 30 through July 2
Summer 2 season 8/6 through 8/19 25-35% higher
Value 2 season 8/20 through 9/9 7-12% higher except
- Labor Day holiday prices 9/1 through 9/3 30-35% higher
Fall season 9/11 through 9/30 20-30% higher
Fall 2 season 10/1 through 10/21 25-35% higher except
- Columbus Day holiday prices 10/6 to 10/8 55-65% higher
Fall 3 season 10/22 through 11/30 20-25% higher except
- Marathon prices 11/2 through 11/4 35-45% higher
- Thanksgiving prices 11/18 through 11/24 45-50% higher
Winter season 12/1 through 12/7 25-40% higher
Winter 2 season 12/8 through 12/14 50-60% higher
Holiday season 12/15 through 12/24 70-85% higher
Holiday 2 season 12/25 through 12/31 80-90% higher
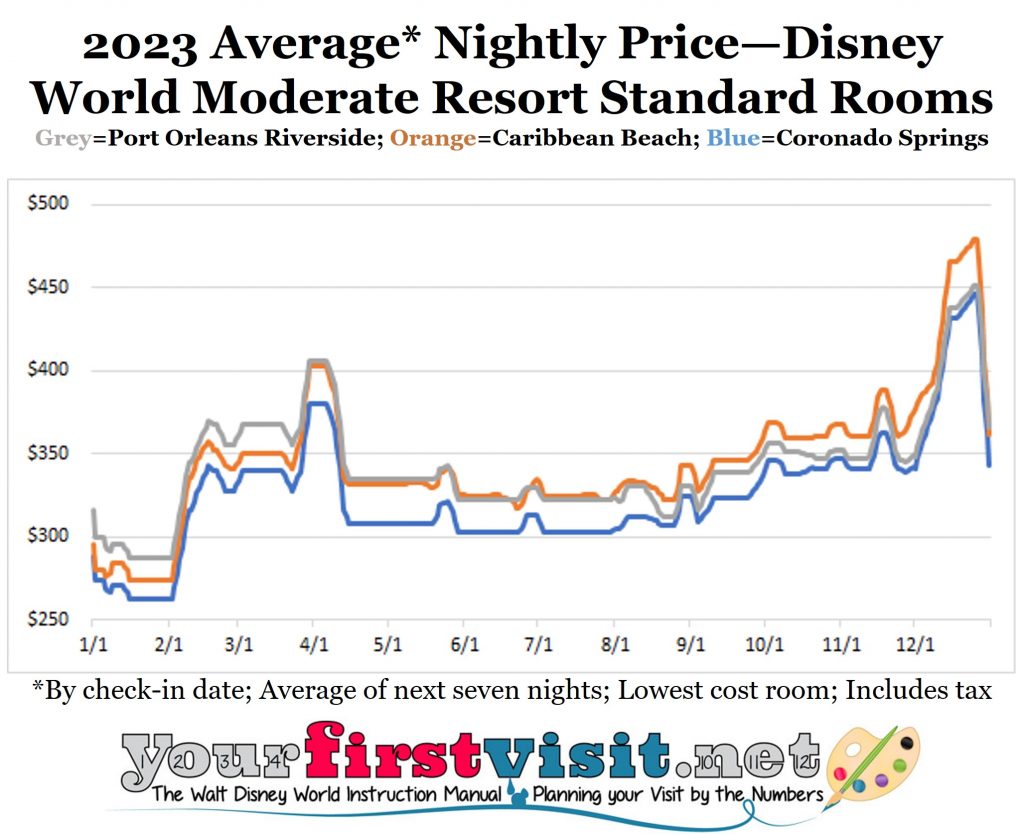
2023 DISNEY WORLD RESORT PRICE SEASONS: MODERATE RESORTS
The lowest prices of the year–the value season–1/2 through 2/8/2023, except:
- January 5-7– 10-15% higher from RunDisney event than lowest of the year
- January 13-15– 10-15% higher for MLK holiday weekend than lowest of the year
Regular season prices 2/9 through 2/16 20% higher than the lowest of the year
Presidents Day holiday prices 2/17 and 2/18 40-45% higher than lowest of the year
Spring season prices 2/29 through 2/26 30% higher
Regular season prices 2/27 through 3/2 20% higher
Spring season prices 3/3 through 3/25 30% higher
Regular season prices 3/26 through 3/29 20% higher
Easter holiday prices 3/30 through 4/12 40-45% higher
Spring season prices 4/13 and 4/14 30% higher
Regular 2 season prices 4/15 through 5/25 15-20% higher
Memorial Day holiday prices 5/26 through 5/28 25-40% higher
Summer season prices 5/29 through 8/5 10-20% higher except
- 4th of July holiday prices 20-35% higher June 30 through July 2
Summer 2 season 8/6 through 8/19 25-20% higher
Value 2 season 8/20 through 9/9 10-20% higher except
- Labor Day holiday prices 9/1 through 9/3 30-40% higher
Fall season 9/11 through 9/30 15-25% higher
Fall 2 season 10/1 through 10/21 20-30% higher except
- Columbus Day holiday prices 10/6 to 10/8 35-45% higher
Fall 3 season 10/22 through 11/30 20-30% higher except
- Marathon prices 11/2 through 11/4 30-45% higher
- Thanksgiving prices 11/18 through 11/24 30-40% higher
Winter season 12/1 through 12/7 20-30% higher
Winter 2 season 12/8 through 12/14 30-45% higher
Holiday season 12/15 through 12/24 55-70% higher
Holiday 2 season 12/25 through 12/31 60-75% higher
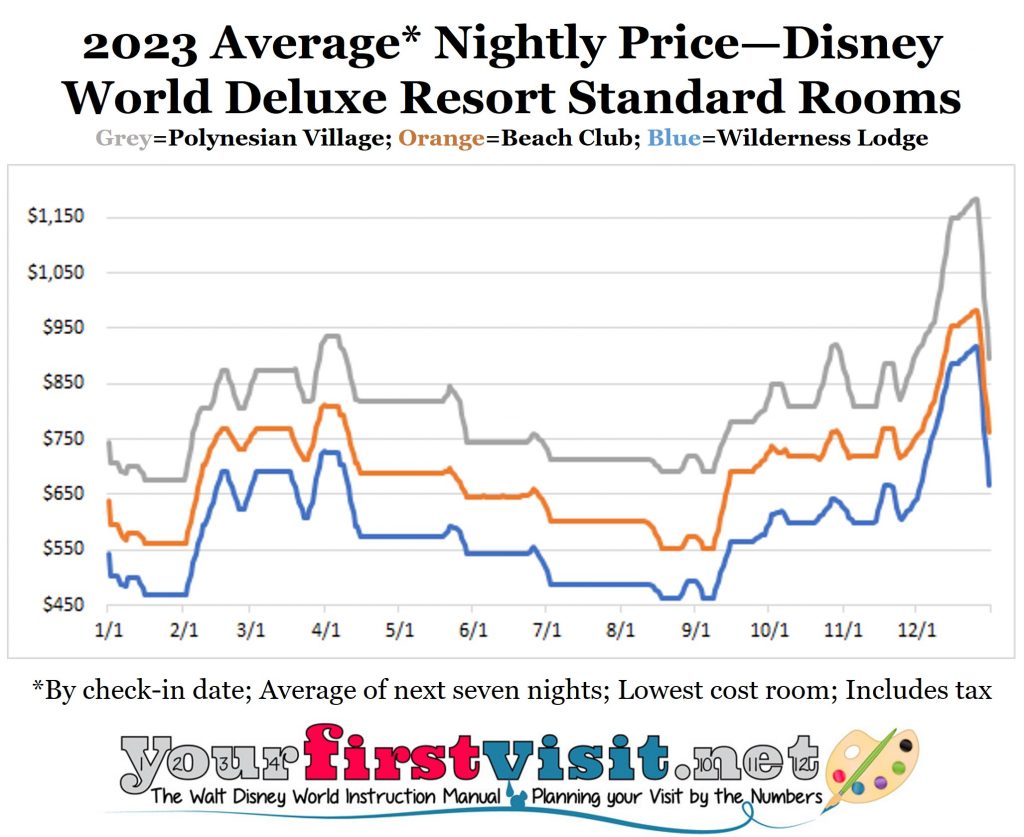
2023 DISNEY WORLD RESORT PRICE SEASONS: DELUXE RESORTS
The lowest prices of the year–the value season–1/2 through 2/8/2023, except:
- January 5-7 15-20% higher from RunDisney event than lowest of the year
- January 13-15 10-120% higher for MLK holiday weekend than lowest of the year
Regular season prices 2/9 through 2/16 20-30% higher than lowest of the year
Spring season prices 2/17 through 2/25 30-50% higher
Regular season prices 2/26 through 3/2 20-30% higher
Spring season prices 3/3 through 3/23 30-50% higher
Regular season prices 3/24 through 3/29 20-30% higher
Spring season prices 3/30 and 3/31 30-50% higher
Easter holiday prices 4/1 through 4/12 40-60% higher
Regular 2 season prices 4/13 20-25% higher
Spring season prices 4/14 30-50% higher
Regular season 2 prices 4/15 through 5/25 20-25% higher
Memorial Day holiday prices 5/26 through 5/28 30-40% higher
Summer season prices 5/29 through 6/29 10-20% higher
4th of July holiday prices 6/30 through 7/2 15-25% higher
Summer 2 season 7/3 through 8/17 5-10% higher
Value 2 season 8/18 through 9/14 0-2% higher except
- Labor Day holiday prices 9/1 through 9/3 15-20% higher
Fall season 9/15 through 10/30 15-25% higher
Fall 2 season 10/1 through 10/5 20-30% higher
Columbus Day holiday prices 10/6 to 10/8 35-45% higher
Fall 3 season 10/9 through 11/30 20-30% higher except
- Halloween prices 10/27 through 11/1 30-35% higher
- Marathon prices 11/2 through 11/4 40-45% higher
- Thanksgiving prices 11/21 through 11/24 40-55% higher
Winter season 12/1 through 12/7 35-40% higher
Winter 2 season 12/8 through 12/14 40-65% higher
Holiday season 12/15 through 12/24 70-90% higher
Holiday 2 season 12/25 through 12/31 75-100% higher
OTHER KEY PAGES FOR WHERE TO STAY AT DISNEY WORLD
- Where to stay–the Basics
- Where first-timers should stay
- Reviews of all the Disney World resorts, based on my 160+ stays in them
My friends at Destinations in Florida, the long-time travel agent partner of this site, can book your Disney World vacation at any Disney World hotel! Contact them using the form below.
Follow yourfirstvisit.net on Facebook or Twitter or Pinterest!!
September 4, 2022 No Comments
2021 Disney World Resort Hotel Price Seasons
2021 RESORT PRICE SEASONS AT WALT DISNEY WORLD
The material below shows Walt Disney World resort hotel price seasons at different times of the year in 2021.
Resort prices can be more than twice as high during some periods as they are at others. The information on this page helps you identify lower and higher cost periods.
Ticket prices also vary by date. Much of the time, you’ll find higher ticket prices at when resort hotel prices are also higher, but there are nuances to this, as the hotel market is more competitive, and for moderates and deluxes in particular, are affected by both the tourist and convention markets. 2021 Disney World ticket prices are here.
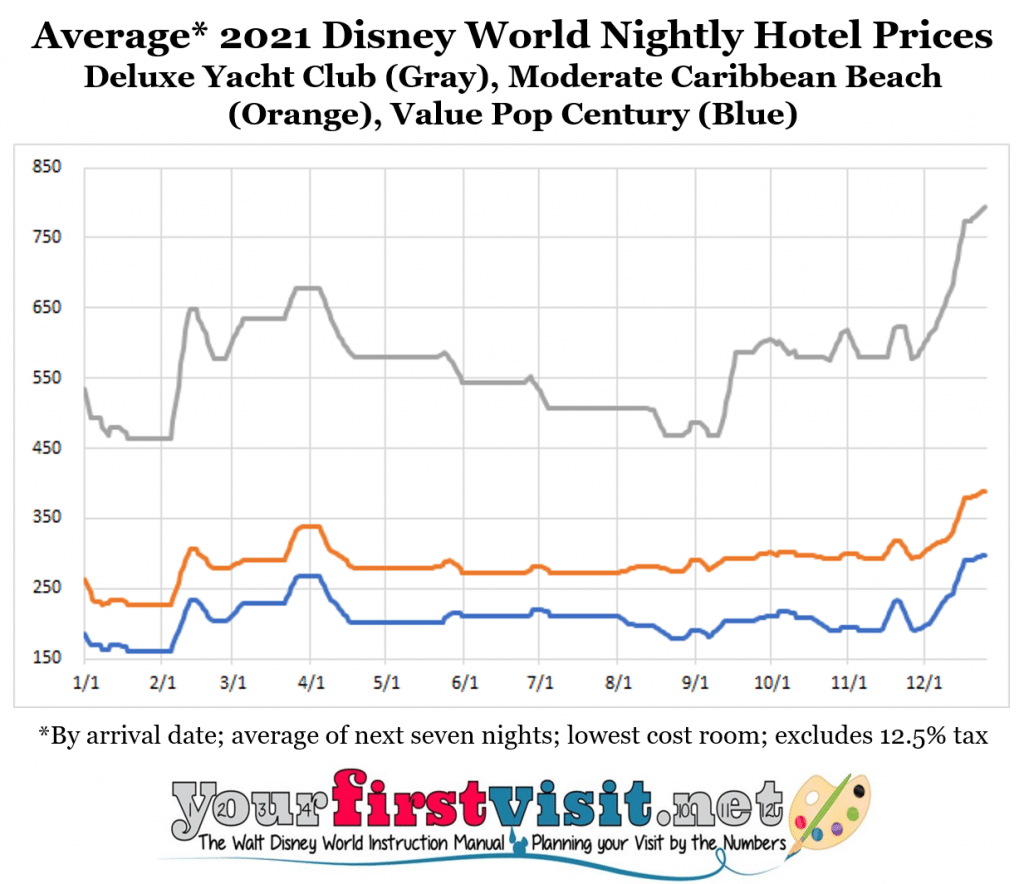
![]() In the below, I compare 2021 hotel prices over the year for each hotel class to that class’s lowest price of the year. I don’t have as many different hotels in the analysis set as I do most years, because many key hotels have not yet re-opened.
In the below, I compare 2021 hotel prices over the year for each hotel class to that class’s lowest price of the year. I don’t have as many different hotels in the analysis set as I do most years, because many key hotels have not yet re-opened.
Grouping of dates is based on “price seasons,” a grouping tool Disney World no longer makes public, but which can be identified analytically, and named (sorta) based on past practices. Disney charges based on the actual price of the actual nights, so if your visit straddles price seasons, you’ll pay the prices of each price season.
The charts average prices over the next seven nights, by arrival date. This eliminates what would be otherwise be incomprehensible bumpiness from Thursday/Sunday and/or Friday/Saturday upcharges. For exact prices by night by room type by date, see MouseSavers.com here.
Price patterns over the year are similar to those of prior years, with the exception of the fourth quarter, when–compared to the rest of the year–they are higher in early October, and do not get quite as low as they used to get after Thanksgiving into early December–while still being low these dates than the holiday dates before and after.
One distinct change that affects the early October pattern is that October 1 and October 2 see a new set of higher prices, which I have named the “Anniversary Season” in honor of Disney World’s 50th anniversary–expected to be celebrated beginning October 1, 2021.
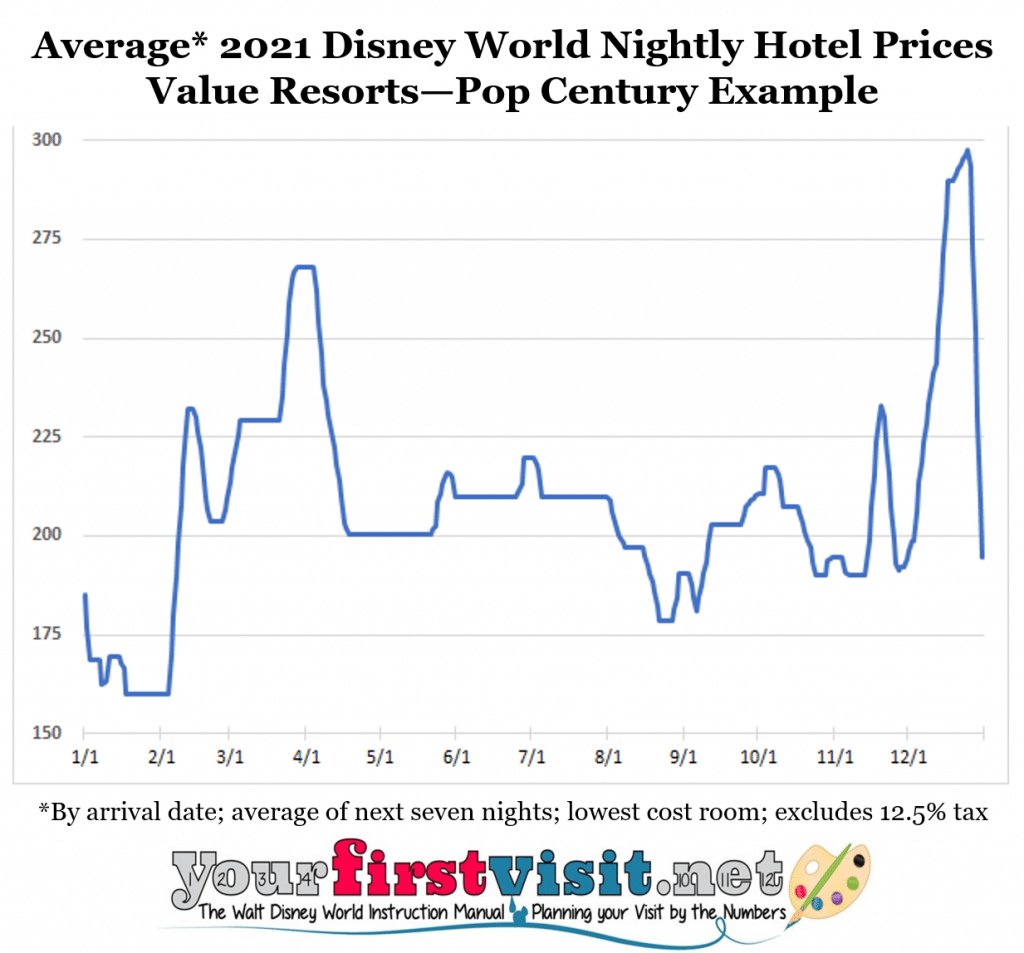
2021 DISNEY WORLD RESORT PRICE SEASONS: VALUE RESORTS
When a range is given, the higher end applies to Fridays and Saturdays, and the lower end to Mondays through Wednesdays. Sundays and Thursdays vary, but are typically closer to the lower end. Disney’s Pop Century Resort prices used to illustrate value resort prices.
- The lowest prices of the year–the value season–begin 1/3/2021
- 40% higher prices–RunDisney rates–begin 1/7/21
- Lowest prices of year–the value season–begin 1/10/21
- 40% higher prices for the Martin Luther King Jr. long weekend begins 1/15/21
- Lowest prices of year–the value season–begin 1/18/21
- 55% higher –the spring season—covers 2/11/21
- 80% higher for the long weekend of Presidents Day begins 2/12/21
- 50-80%% higher –the spring season—begins 2/15/21
- 80% higher–RunDisney rates—begins 2/18/21
- 30%-65% higher–the regular season–begins 2/21/21
- 50-80% higher–the spring season–begins 3/5/21
- 85% higher–the Easter season–begins 3/28/21
- 50-80% higher–the spring season–begins 4/11/21
- 65% higher –RunDisney rates—begins 4/15/21
- 30-60% higher–the regular 2 season–begins 4/18/21
- 65% higher over the Memorial Day long weekend begins 5/28/21
- 40-65% higher–the summer season–begins 5/31/21
- 70% higher over the long 4th of July weekend begins 7/2/21
- 40-65% higher–the summer season–begins 7/5/21
- 25-55% higher–the summer 2 season–begins 8/8/21
- 15-40% higher–the fall season–begins 8/22/21
- 55% higher over the long Labor Day weekend begins 9/3/21
- 15-40% higher–the fall season–begins 9/6/21
- 30-60% higher–the fall 2 season–begins 9/12/21
- 75% higher—the Anniversary season—begins 10/1
- 30-60% higher–the fall 2 season–begins 10/3/21
- 70% higher over the long Columbus Day weekend begins 10/8/21
- 30-60% higher–the fall 2 season–begins 10/11/21
- 20-50% higher–the fall 3 season– begins 10/24/21
- 50% higher–RunDisney rates, I expect—begins 11/4/21
- 20-50% higher–the fall 3 season– begins 11/7/21
- 60% higher over Thanksgiving begins 11/20/21
- 20-50% higher–the fall 3 season–begins 11/27/21
- 30-55% higher–the fall 4 season–begins 12/3/21
- 55-90% higher–the holiday season–begins 12/10/21
- 100% higher–the holiday 2 season–begins 12/17/21
- 110% higher–the holiday 3 season–begins 12/26/21
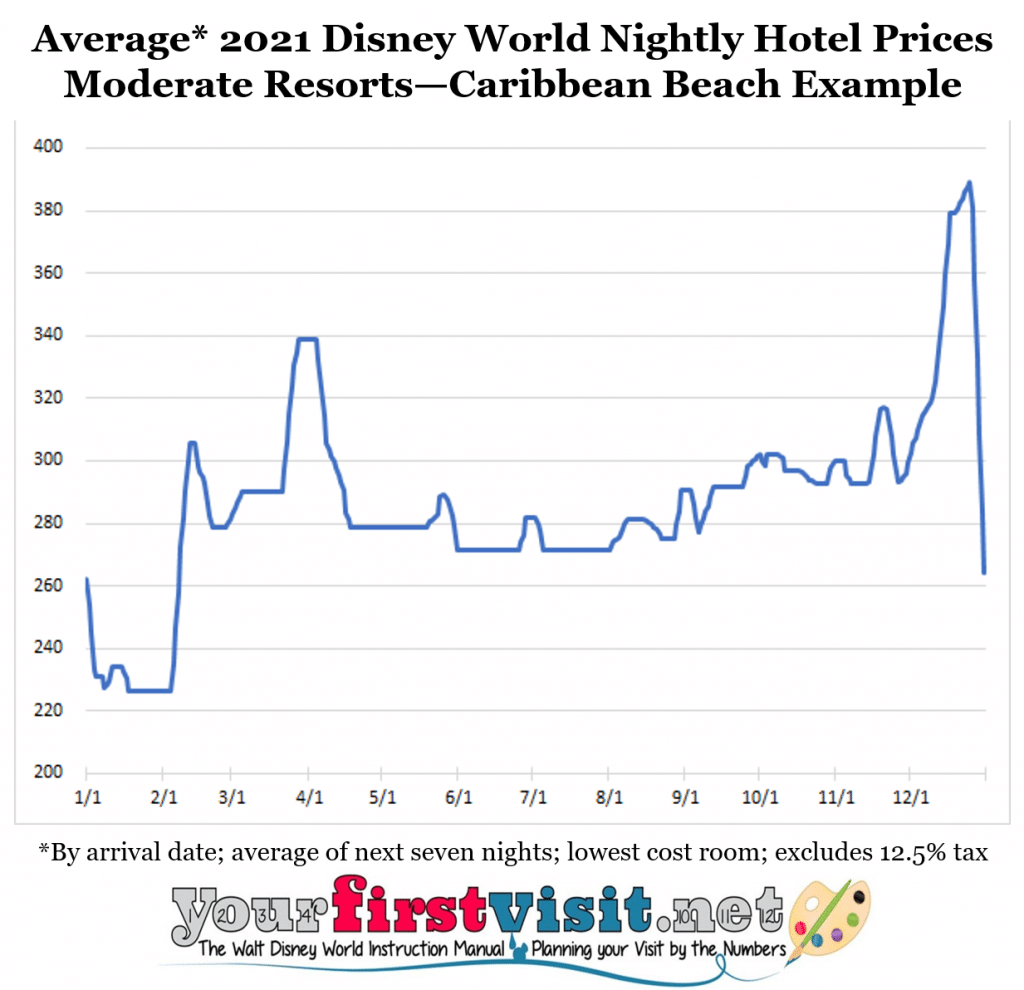
2021 DISNEY WORLD RESORT PRICE SEASONS: MODERATE RESORTS
When a range is given, the higher end applies to Fridays and Saturdays, and the lower end to Mondays through Wednesdays. Sundays and Thursdays vary, but are typically closer to the lower end. Disney’s Caribbean Beach Resort prices used to illustrate moderate resort prices.
- The lowest prices of the year–the value season–begin 1/3/2021
- 20% higher prices–RunDisney rates–begin 1/7/21
- Lowest prices of year–the value season–begin 1/10/21
- 20% higher prices for the Martin Luther King Jr. long weekend begins 1/15/21
- Lowest prices of year–the value season–begin 1/18/21
- 35% higher –the spring season—covers 2/11/21
- 55% higher for the long weekend of Presidents Day begins 2/12/21
- 30-45% higher –the spring season—begins 2/15/21
- 55% higher–RunDisney rates—begins 2/18/21
- 25%-40% higher–the regular season–begins 2/21/21
- 30-45% higher–the spring season–begins 3/5/21
- 60% higher–the Easter season–begins 3/28/21
- 30-45% higher–the spring season–begins 4/11/21
- 55% higher –RunDisney rates—begins 4/15/21
- 25-45% higher–the regular 2 season–begins 4/18/21
- 50% higher over the Memorial Day long weekend begins 5/28/21
- 25-35% higher–the summer season–begins 5/31/21
- 45% higher over the long 4th of July weekend begins 7/2/21
- 25-35% higher–the summer season–begins 7/5/21
- 25-40% higher–the summer 2 season–begins 8/8/21
- 25-40% higher–the fall season–begins 8/22/21
- 50% higher over the long Labor Day weekend begins 9/3/21
- 25-40% higher–the fall season–begins 9/6/21
- 35-50% higher–the fall 2 season–begins 9/12/21
- 60% higher—the Anniversary season—begins 10/1
- 35-50% higher–the fall 2 season–begins 10/3/21
- 50% higher over the long Columbus Day weekend begins 10/8/21
- 35-50% higher–the fall 2 season–begins 10/11/21
- 30-50% higher–the fall 3 season– begins 10/24/21
- 50% higher–RunDisney rates, I expect—begins 11/4/21
- 30-50% higher–the fall 3 season– begins 11/7/21
- 50% higher over Thanksgiving begins 11/20/21
- 30-50% higher–the fall 3 season–begins 11/27/21
- 40-50% higher–the fall 4 season–begins 12/3/21
- 45-60% higher–the holiday season–begins 12/10/21
- 80% higher–the holiday 2 season–begins 12/17/21
- 85% higher–the holiday 3 season–begins 12/26/21
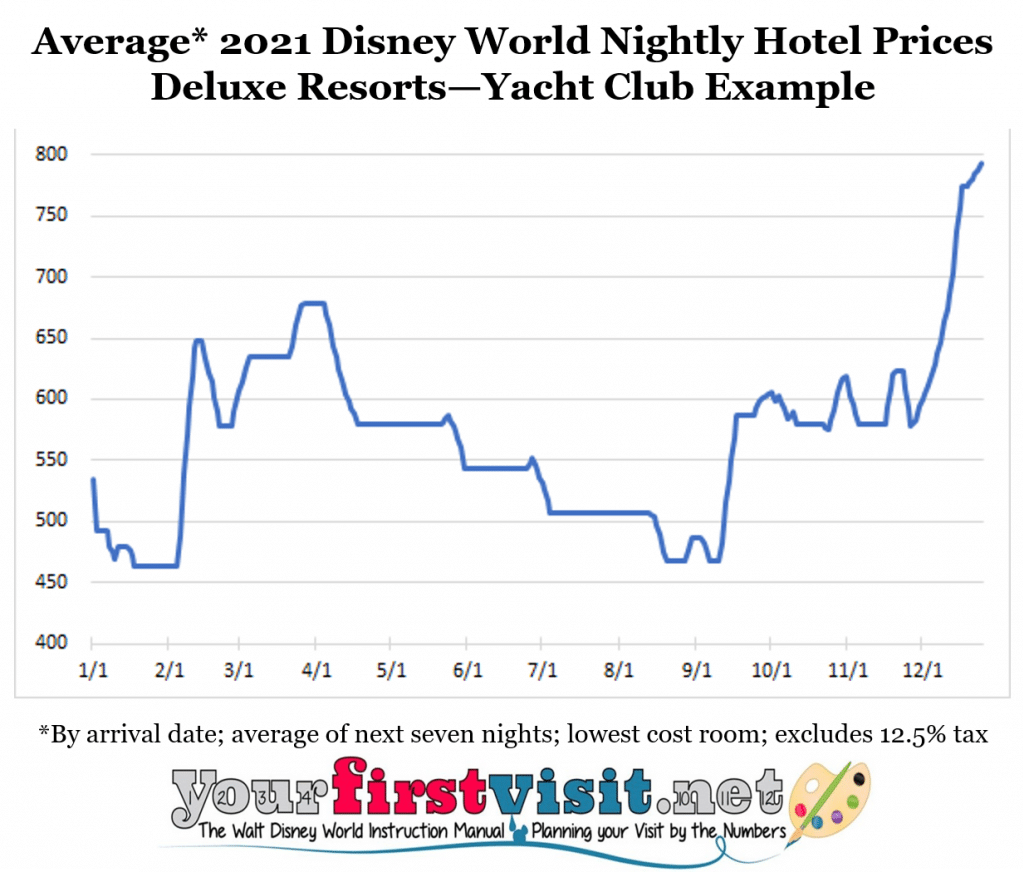
2021 DISNEY WORLD RESORT PRICE SEASONS: DELUXE RESORTS
When a range is given, the higher end applies to Fridays and Saturdays, and the lower end to Mondays through Wednesdays. Sundays and Thursdays vary, but are typically closer to the lower end. Disney’s Yacht Club Resort prices used to illustrate deluxe resort prices.
- The lowest prices of the year–the value season–begin 1/3/2021
- 25% higher prices–RunDisney rates–begin 1/7/21
- Lowest prices of year–the value season–begin 1/10/21
- 25% higher prices for the Martin Luther King Jr. long weekend begins 1/15/21
- Lowest prices of year–the value season–begin 1/18/21
- 40% higher –the spring season—covers 2/11/21
- 50% higher for the long weekend of Presidents Day begins 2/12/21
- 40-50% higher –the spring season—begins 2/15/21
- 50% higher–RunDisney rates—begins 2/18/21
- 30% higher–the regular season–begins 2/21/21
- 40-50% higher–the spring season–begins 3/5/21
- 50% higher–the Easter season–begins 3/28/21
- 40-50% higher–the spring season–begins 4/11/21
- 40% higher –RunDisney rates—begins 4/15/21
- 30% higher–the regular 2 season–begins 4/18/21
- 35% higher over the Memorial Day long weekend begins 5/28/21
- 20% higher–the summer season–begins 5/31/21
- 30% higher over the long 4th of July weekend begins 7/2/21
- 15% higher—the summer season 2—begins 7/5/21
- 5-10% higher—the value season 2—begins 8/20/21
- 20% higher over the long Labor Day weekend begins 9/3/21
- 5-10% higher—the value season 2—begins 9/6/21
- 30-35% higher–the fall season–begins 9/17/21
- 45% higher—the Anniversary season—begins 10/1
- 30-35% higher–the fall season–begins 10/3/21
- 40% higher over the long Columbus Day weekend begins 10/8/21
- 25-40% higher–the fall 2 season–begins 10/11/21
- 35-40% higher–the fall 3 season– begins 10/29/21
- 40% higher–RunDisney rates, I expect—begins 11/4/21
- 25-40% higher–the fall 2 season– begins 11/7/21
- 45% higher over Thanksgiving begins 11/23/21
- 25-40% higher–the fall 2 season–begins 11/27/21
- 30-50% higher–the fall 4 season–begins 12/3/21
- 45-55% higher–the holiday season–begins 12/10/21
- 75% higher–the holiday 2 season–begins 12/17/21
- 80% higher–the holiday 3 season–begins 12/26/21
OTHER KEY PAGES FOR WHERE TO STAY AT DISNEY WORLD
- Where to stay–the Basics
- Where first-timers should stay
- Reviews of all the Disney World resorts, based on my 160+ stays in them
Kelly, the long-time travel agent partner of this site, can book your Disney World vacation at any Disney World hotel! Contact her using the form below.

Follow yourfirstvisit.net on Facebook or Twitter or Pinterest!!
December 31, 2020 No Comments
Disney World 2021 Ticket Prices in a Color-Coded Calendar
I’ve color coded the start dates of the various base ticket lengths in Disney World’s date-based ticket pricing system to indicate less and more expensive ticket dates in 2021, compared to prices in all of 2021.
The prices I show are pre-tax, per ticket day, and rounded to the nearest dollar. For 2021, I left out 1 and 2 day tickets, as they are of less interest and technically harder to color code.
In what follows, compared to other dates for the same ticket length
- The more and the darker the green, the better
- The more and the darker the red, the worse.
Dates with black text on a white background are everything else–you can think of them as “typical” or “average” for that ticket length. The technical details on how I color coded are at the end of the post.
I begin with an overview of the year see you can see the flow of 2021 price colors in one spot, and then move to two-month calendars.
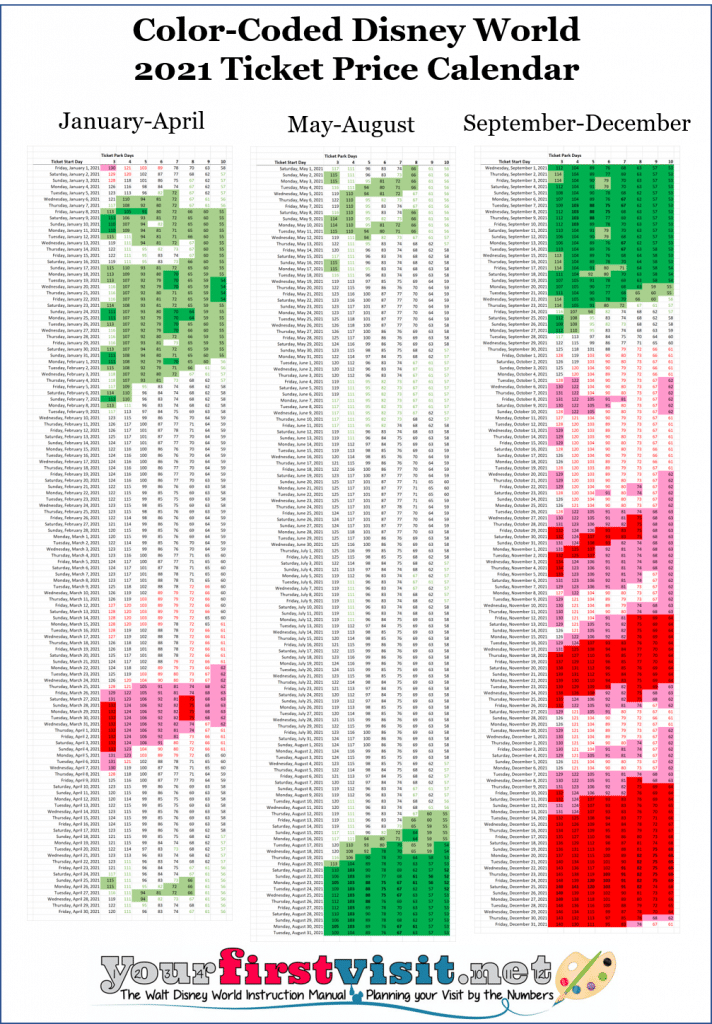
If you compare 2021 colors to 2020 colors, you’ll note that while the rough calendar of reddish and greenish periods is the same as 2020, there are more red dates in the fourth quarter of 2021 than I have ever seen before.
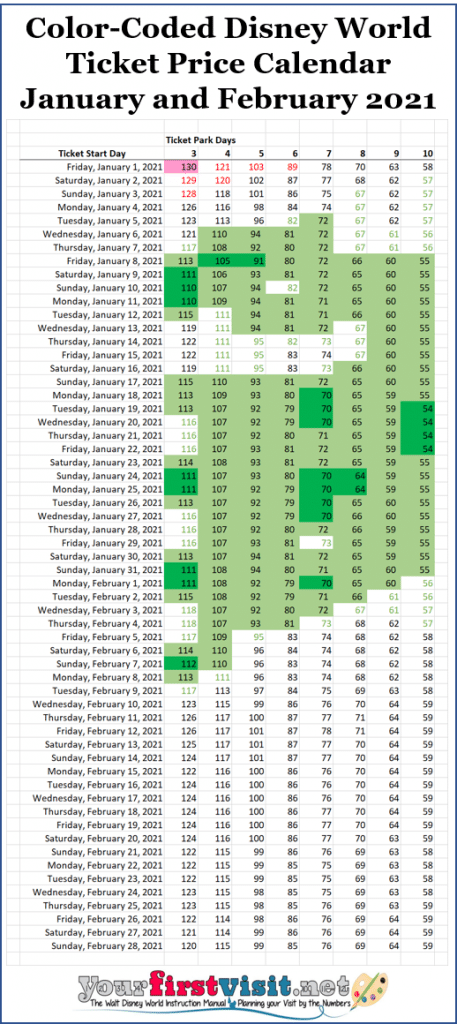
JANUARY AND FEBRUARY 2021 DISNEY WORLD TICKET PRICES
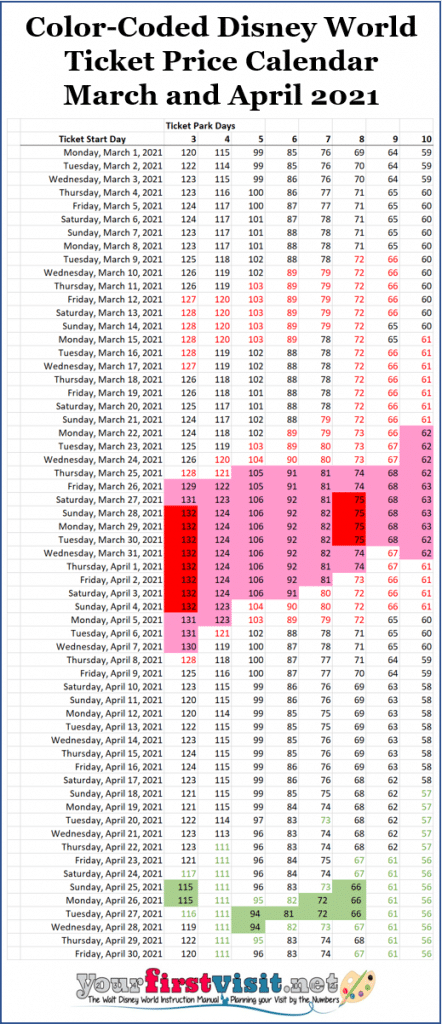
MARCH AND APRIL 2021 DISNEY WORLD TICKET PRICES
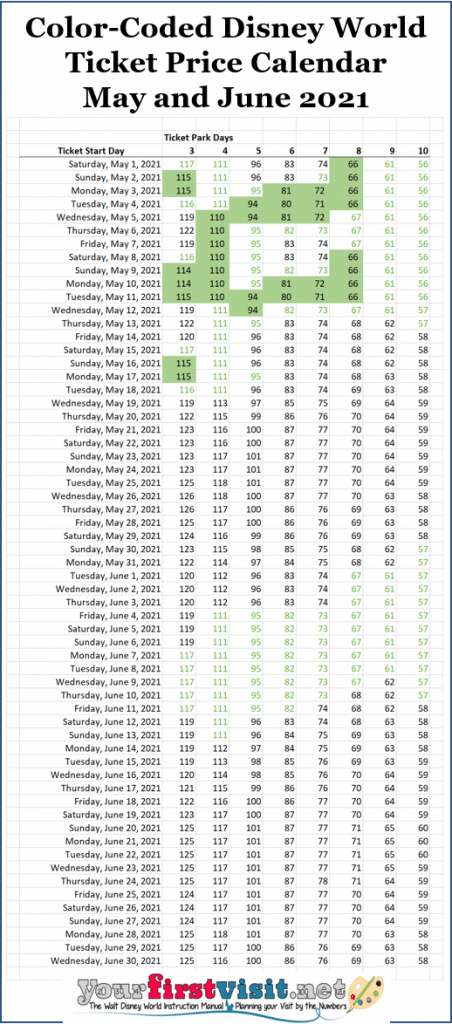
MAY AND JUNE 2021 DISNEY WORLD TICKET PRICES
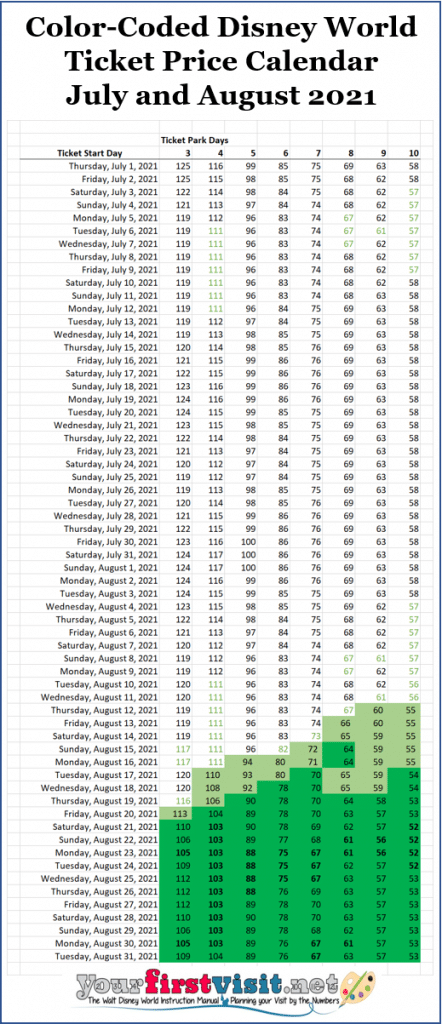
JULY AND AUGUST 2021 DISNEY WORLD TICKET PRICES
SEPTEMBER AND OCTOBER 2021 DISNEY WORLD TICKET PRICES
![]()
NOVEMBER AND DECEMBER 2021 DISNEY WORLD TICKET PRICES
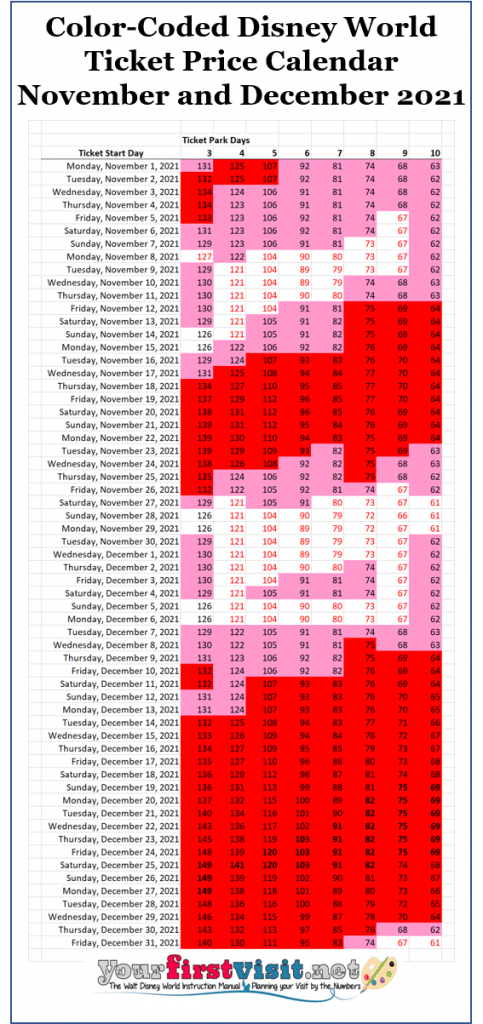
TECHNICAL DETAILS OF COLOR CODING
For each ticket length:
- Ticket prices approximately in the bottom 10% have darker green fill and black text, with the very lowest bolded
- Ticket prices approximately in the next lowest 10% have a lighter green fill and black text
- The next approximately 10% of prices has white fill and green text
- Dates with prices approximately in the 70th to 80th percentile have white fill and red text
- Prices approximately in the 80th to 90th percentile have a light red pinkish fill and black text
- Prices in roughly the top 10% for the year have a darker red fill and black text, with the very highest bolded
- Every other price in between has black text and white fill.
Note that my work is largely based on the rounded per-day prices Disney published. As a result, the “10%” breaks are not exact. Prices shown are also pre-tax.
Follow yourfirstvisit.net on Facebook or Twitter or Pinterest!!
December 31, 2020 No Comments
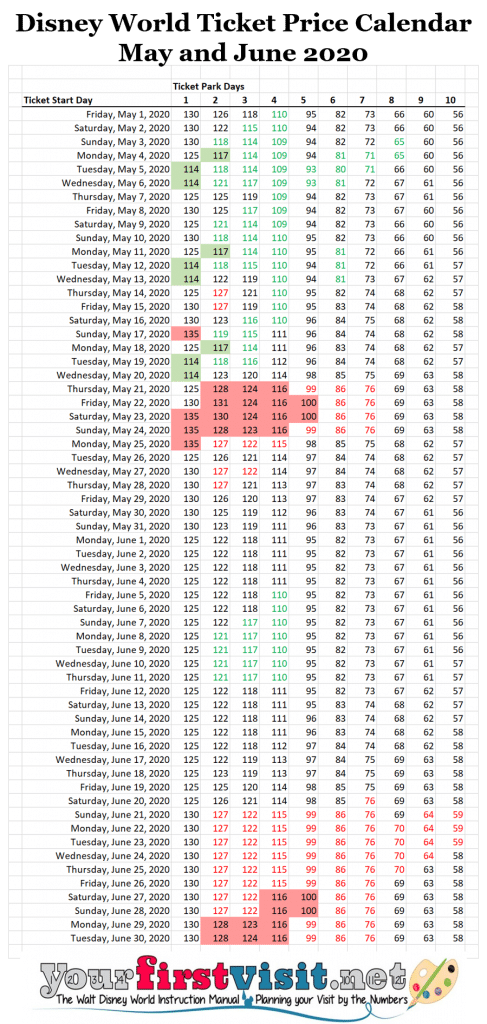
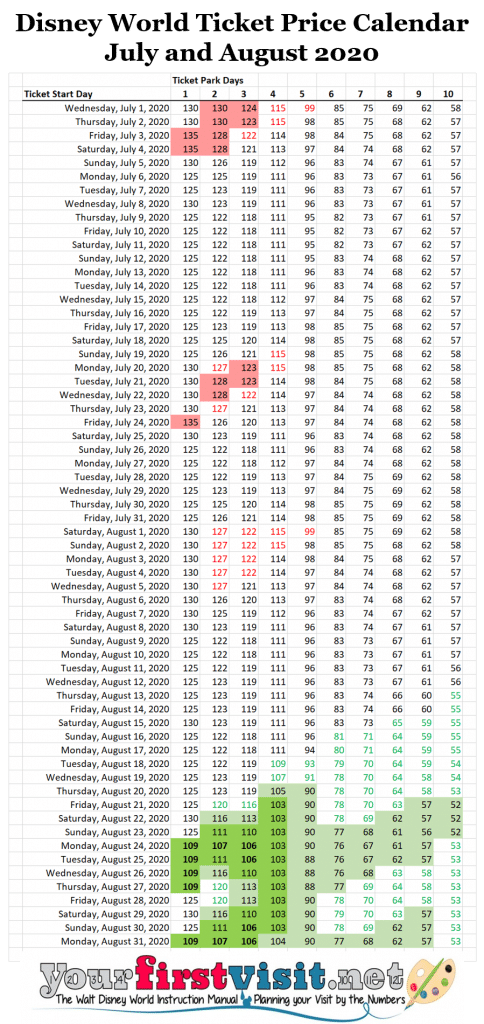
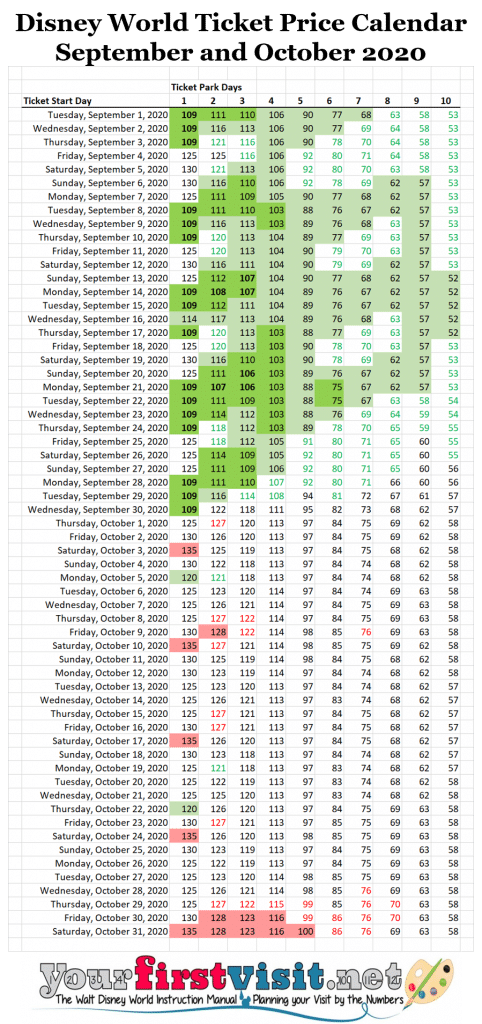
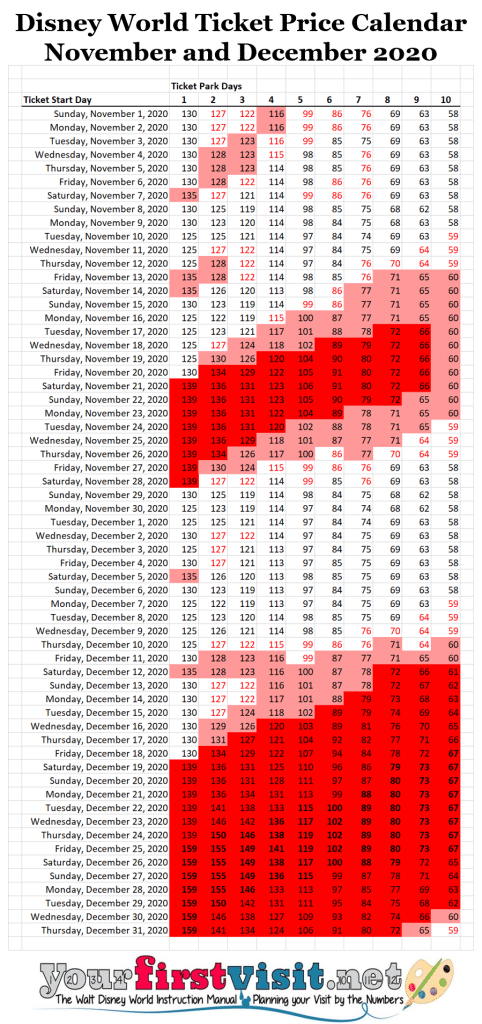
Color-Coded Calendar for Disney World 2020 Ticket Prices
I’ve color coded the start dates of the various base ticket lengths in Disney World’s date-based ticket pricing system to indicate less and more expensive ticket dates in 2020, compared to available prices in all of 2020. The prices I show are pre-tax, per ticket day, and rounded to the nearest dollar.
In what follows, basically
- The more and the darker the green, the better
- The more and the darker the red, the worse.
Dates with black text on a white background are everything else–you can think of them as “typical” or “average.” The technical details on how I color coded are at the end of the post.
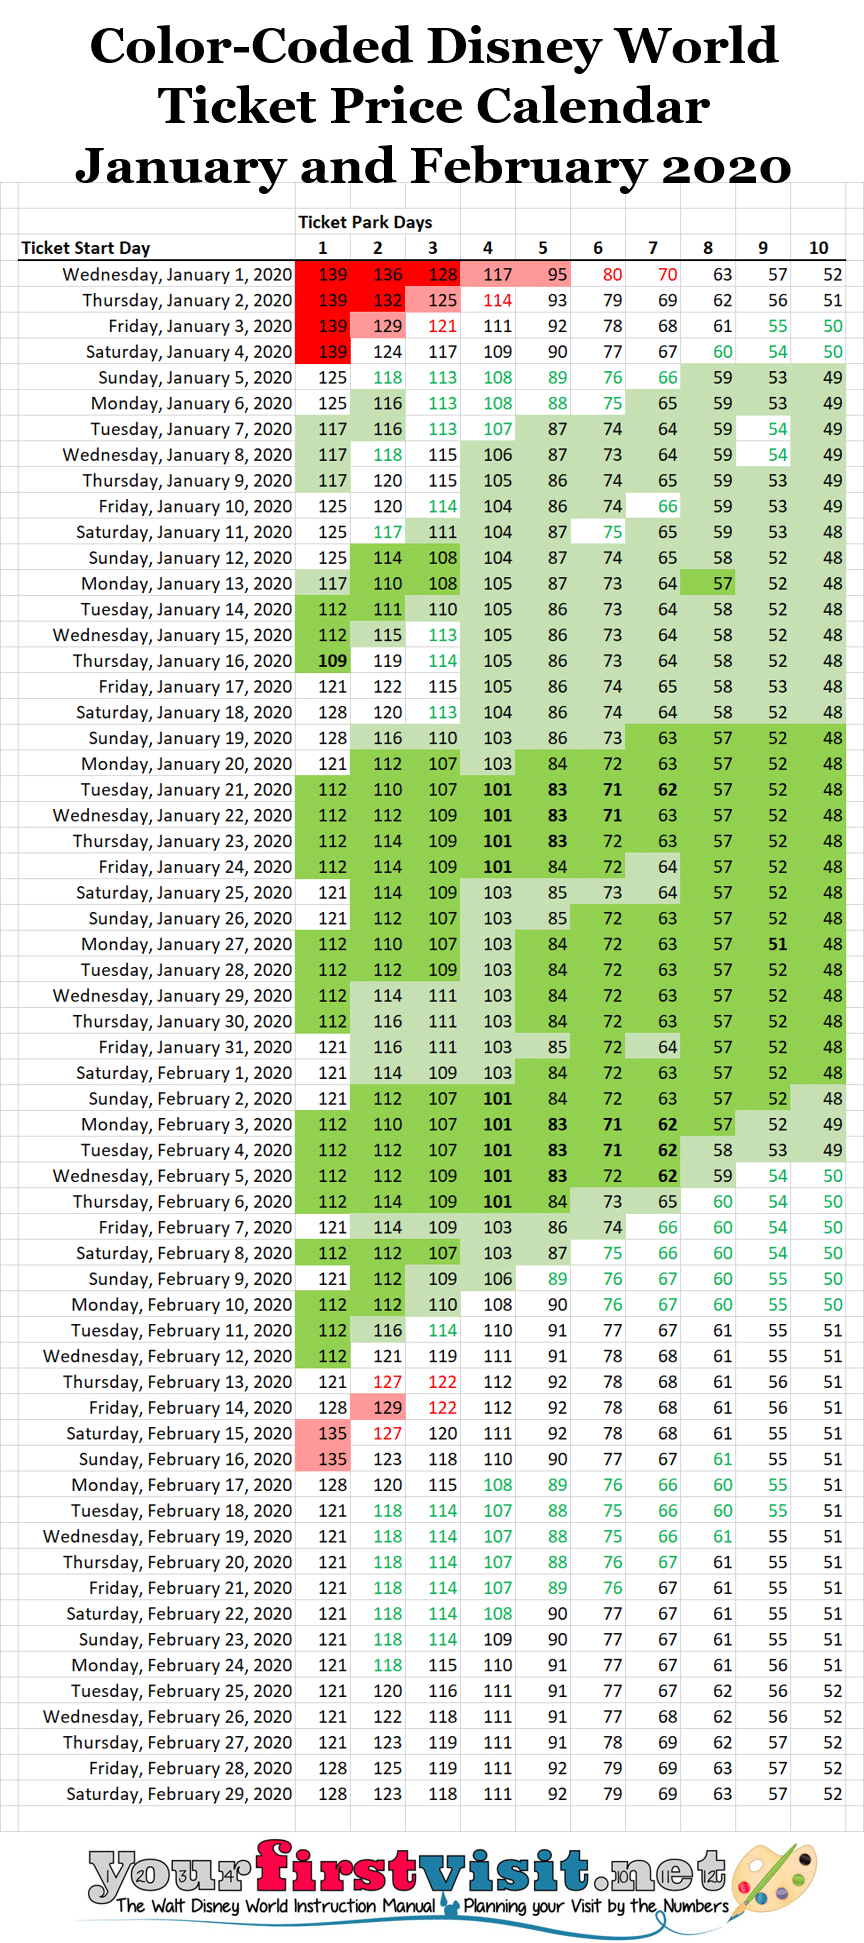
JANUARY AND FEBRUARY 2020 DISNEY WORLD TICKET PRICES
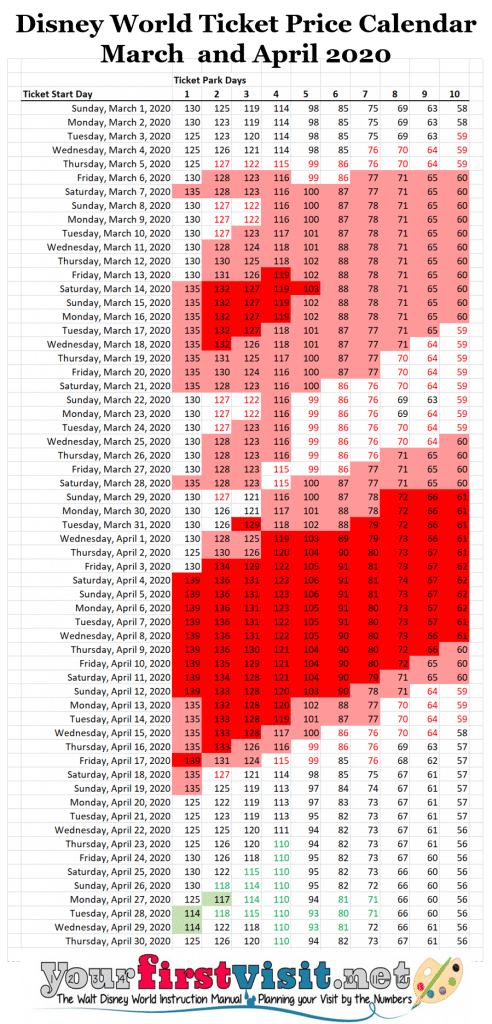
MARCH AND APRIL 2020 DISNEY WORLD TICKET PRICES
MAY AND JUNE 2020 DISNEY WORLD TICKET PRICES
JULY AND AUGUST 2020 DISNEY WORLD TICKET PRICES
SEPTEMBER AND OCTOBER 2020 DISNEY WORLD TICKET PRICES
NOVEMBER AND DECEMBER 2020 DISNEY WORLD TICKET PRICES
TECHNICAL DETAILS OF COLOR CODING
- The lowest prices for a ticket length have darker green fill and bolded black text
- Ticket prices approximately in the bottom 10% have darker green fill and black text
- Ticket prices approximately in the next lowest 10% have a lighter green fill and black text
- The next approximately 10% of prices has white fill and green text
- Dates with prices approximately in the 70th to 80th percentile have white fill and red text
- Prices approximately in the 80th to 90th percentile have a light red fill and black text
- Prices in roughly the top 10% for the year have a darker red fill and black text
- The highest price of the year for that ticket type has darker red fill and bold black text
- Every other price in between has black text and white fill.
Note that my work is largely based on the rounded prices Disney published. As a result, the “10%” breaks are not exact. Prices shown are also pre-tax.
Follow yourfirstvisit.net on Facebook or Twitter or Pinterest!!
July 21, 2019 No Comments
Disney World 2020 Resort Hotel Price Seasons
2020 RESORT PRICE SEASONS AT WALT DISNEY WORLD
The material below shows my forecast resort price seasons at Walt Disney World at different times of the year in 2020. My forecasts are based on recent Disney practice, and I will revise them once Disney World publishes its actual 2020 resort hotel prices—likely in the summer of 2019.
Resort prices can be almost twice as high during some periods as they are at others. My forecasts help you identify lower and higher cost periods.
My comparisons are to prices that are “the lowest of the year,” the value season.
 Grouping of dates is based on “price seasons,” a grouping tool Disney World no longer makes public, but which can be identified analytically. Disney charges based on the actual price of the actual nights, so if your visit straddles price seasons, you’ll pay the prices of each price season.
(For more on 2020 at Disney World, see this. For 2019 price seasons, see this. For the basics on where to stay at Disney World, see this.)
2020 DISNEY WORLD FORECAST RESORT PRICE SEASONS: VALUE RESORTS
- The lowest prices of the year–the value season–begins 1/2/2020
- 20-30% higher prices–Marathon rates–begin 1/9/20
- Lowest prices of year–the value season–begin 1/12/20
- 20-25% higher for the Martin Luther King Jr. long weekend begins 1/17/20
- Lowest prices of year–the value season–begin 1/20/20
- 55-65% higher for the long Presidents Day weekend begins 2/13/20
- 35-45% higher–the peak season–begins 2/17/20
- 20-30% higher–the regular season–begins 2/23/20
- 35-45% higher–the peak season–begins 3/6/20
- 60-65% higher–the Easter season–begins 4/5/20
- 20-30% higher–the regular season 2–begins 4/19/20
- 45-50 higher over the Memorial Day long weekend begins 5/22
- 30-40% higher–the summer season–begins 5/25/20
- 20-25% higher–the summer 2 season–begins 8/9/20
- 5-10% higher–the fall season–begins 8/23/20
- 20-25% higher–the regular 3 season–begins 9/13/20
- 40-50% higher over the long Columbus Day weekend begins 10/9/20
- 20-25% higher–the regular 3 season–begins 10/12/20
- 5-10% higher–the fall 2 season– begins 10/25/20
- 30-35% higher over Thanksgiving begins 11/21/20
- 5-10% higher–the fall 2 season–begins 11/28/20
- 10-20% higher–the regular 4 season–begins 12/6/20
- 35-45% higher–the peak season–begins 12/11/20
- 60-70% higher–the holiday season–begins 12/18/20
2020 DISNEY WORLD FORECAST RESORT PRICE SEASONS: MODERATE RESORTS
- The lowest prices of the year–the value season–begin 1/2/2020
- 15% higher prices–Marathon rates–begin 1/9/20
- Lowest prices of year–the value season–begin 1/12/20
- 10-15% higher for the Martin Luther King Jr. long weekend begins 1/17/20
- Lowest prices of year–the value season–begin 1/20/20
- 35-45% higher for the long Presidents Day weekend begins 2/13/20
- 25% higher–the peak season–begins 2/17/20
- 20% higher–the regular season–begins 2/23/20
- 25% higher–the peak season–begins 3/6/20
- 40-45% higher–the Easter season–begins 4/5/20
- 15-20% higher–the regular season 2–begins 4/19/20
- 25-35% higher over the Memorial Day long weekend begins 5/22
- 14-17% higher–the summer season–begins 5/25/20
- 16-22% higher–the summer 2 season–begins 8/9/20
- 10-20% higher–the fall season–begins 8/23/20
- 15-25% higher–the regular 3 season–begins 9/13/20
- 25-35% higher over the long Columbus Day weekend begins 10/9/20
- 15-25% higher–the regular 3 season–begins 10/12/20
- 10-18% higher–the fall 2 season– begins 10/25/20
- 20-25% higher over Thanksgiving begins 11/21/20
- 10-18% higher–the fall 2 season–begins 11/28/20
- 10-20% higher–the regular 4 season–begins 12/6/20
- 325% higher–the peak season–begins 12/11/20
- 45-55% higher–the holiday season–begins 12/18/20
2020 DISNEY WORLD RESORT FORECAST PRICE SEASONS: DELUXE RESORTS
- The lowest prices of the year–the value season–begin 1/2/2020
- 15-20% higher prices–Marathon rates–begin 1/9/20
- Lowest prices of year–the value season–begin 1/12/20
- 15-20% higher for the Martin Luther King Jr. long weekend begins 1/17/20
- Lowest prices of year–the value season–begin 1/20/20
- 40-55% higher for the long Presidents Day weekend begins 2/13/20
- 30-45% higher–the peak season–begins 2/17/20
- 20-25% higher–the regular season–begins 2/21/20
- 30-45% higher–the peak season–begins 3/6/20
- 50-60% higher–the Easter season–begins 4/5/20
- 20-25% higher–the regular season 2–begins 4/19/20
- 25-35 higher over the Memorial Day long weekend begins 5/22
- 10-17% higher–the summer season–begins 5/25/20
- 5-10% higher–near-lowest of year–the value season 2–begins 7/12/20
- Lowest of year–the value season–begins 8/21/20
- Prices bump up on 9/4/20 to 15% higher than the lowest of the year for the long Labor Day
weekend
Lowest of the year–the value season–begins 9/7/20 - 10-20% higher–the regular season 3–begins 9/18/20
- Prices increase to 25-30% higher than the lowest of the year for the long Columbus Day weekend on 10/9/20
- 5-15% higher–the fall season–begins 10/12/20
- 20-25% higher–the regular season 4–begins 10/30/20
- 5-15% higher–the fall season–begins 11/8/20
- 25-40% higher during Thanksgiving begins 11/24/20
- 5-15% higher–the fall season–begins 11/28/20
- 15-20% higher–the regular season 4 or 5 or something–begins 12/6/20
- 30-45% higher–the peak season–begins 12/11/20
- 55-75% higher–the holiday season–begins 12/18/20
OTHER KEY PAGES FOR WHERE TO STAY AT DISNEY WORLD
- Where to stay–the Basics
- Where first-timers should stay
- Reviews of all the Disney World resorts, based on my 160+ stays in them

Follow yourfirstvisit.net on Facebook or Twitter or Pinterest!!
January 8, 2019 4 Comments
Disney World 2019 Resort Price Seasons
2019 RESORT PRICE SEASONS AT WALT DISNEY WORLD
The material below shows resort price seasons at Walt Disney World at different times of the year in 2019. Resort prices can be almost twice as high during some periods as they are at others. (For 2020 price seasons, see this.)
The text part is based on “price seasons,” a grouping tool Disney World no longer makes public, but which can be identified analytically. Disney charges based on the price of the actual nights, so if your visit straddles price seasons, you’ll pay the prices of each price season.
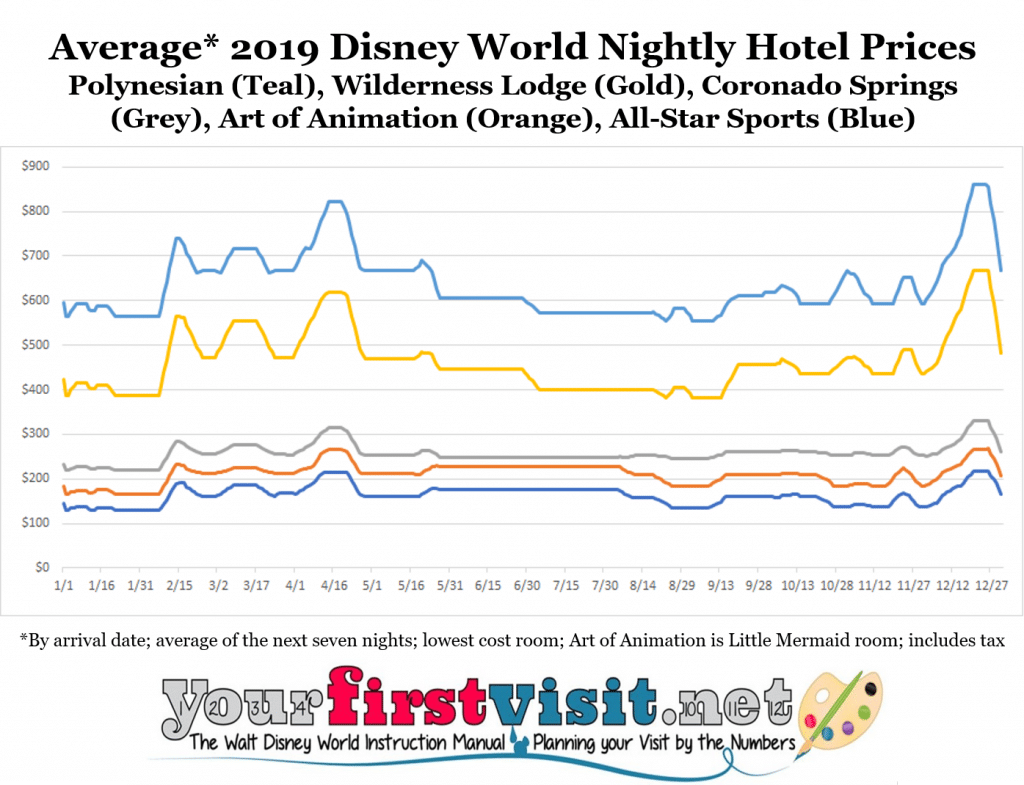 The charts average prices over the next seven nights, by arrival date. This eliminates what would be otherwise be incomprehensible bumpiness from Thursday/Sunday and Friday/Saturday upcharges. For exact prices by night by room type by date, see MouseSavers.com here.
My comparisons are to prices that are “the lowest of the year,” the value season. By this I mean the average nightly price of the lowest-priced seven night period during the value season. I use seven night comparisons because there’s as many as three different prices during a seven night period in a price season, but they follow a weekly pattern.
For longer seasons, my “x% higher” compares average prices over seven nights of that season. For shorter seasons (for example, the many three day weekend upcharges) I compare the exact short-season prices to the seven-day prices. In the material below, “X% Higher” means compared to the lowest prices of the year.

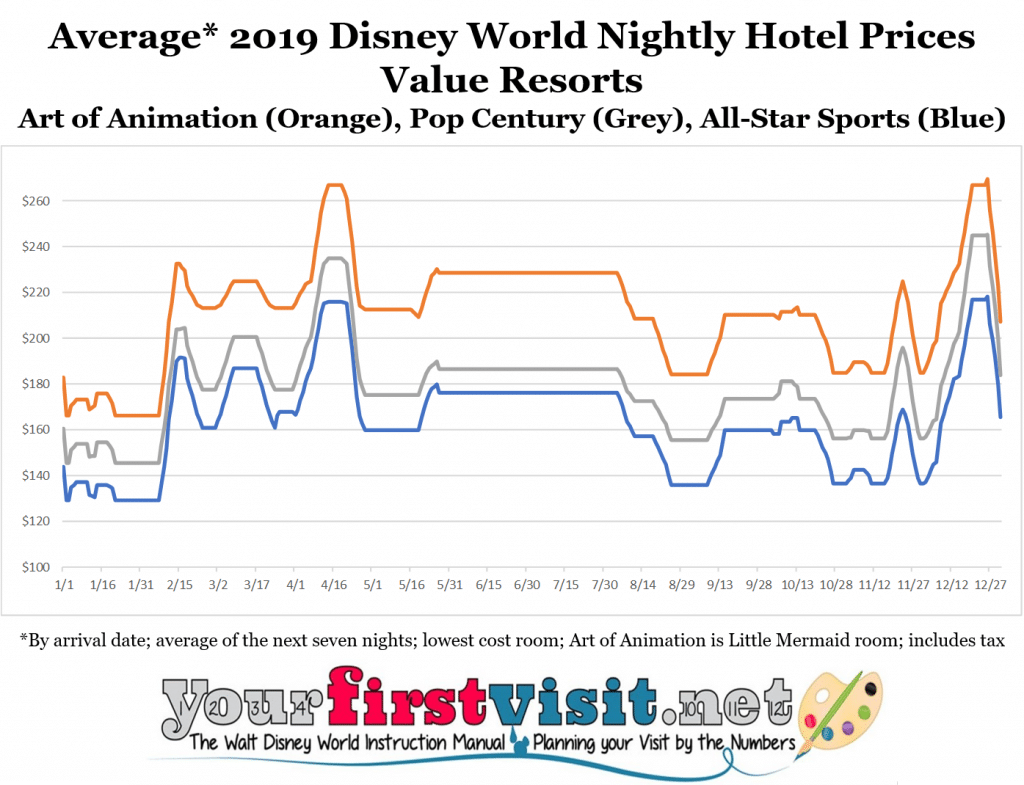
2019 DISNEY WORLD PRICE SEASONS: VALUE RESORTS
- The lowest prices of the year–the value season–begins 1/2/2019
- 20-30% higher prices–Marathon rates–begin 1/10/19
- Lowest prices of year–the value season–begin 1/13/19
- 20-25% higher for the Martin Luther King Jr. long weekend begins 1/18/19
- Lowest prices of year–the value season–begin 1/21/19
- 55-65% higher for the long Presidents Day weekend begins 2/14/19
- 35-45% higher–the peak season–begins 2/18/19
- 20-30% higher–the regular season–begins 2/24/19
- 35-45% higher–the peak season–begins 3/8/19
- 20-30% higher–the regular season–begins 3/24/19
- 35-45% higher–the peak season–begins 4/7/19
- 60-65% higher–the Easter season–begins 4/14/19
- 20-30% higher–the regular season 2–begins 4/28/19
- 45-50 higher over the Memorial Day long weekend begins 5/24
- 30-40% higher–the summer season–begins 5/27/19
- 20-25% higher–the summer 2 season–begins 8/11/19
- 5-10% higher–the fall season–begins 8/25/19
- 20-25% higher–the regular 3 season–begins 9/15/19
- 40-50% higher over the long Columbus Day weekend begins 10/11/19
- 20-25% higher–the regular 3 season–begins 10/14/19
- 5-10% higher–the fall 2 season– begins 10/27/19
- 20-25% higher over the long Veterans Day weekend begins 11/8
- 5-10% higher–the fall 2 season–begins 11/11
- 30-35% higher over Thanksgiving begins 11/23/19
- 5-10% higher–the fall 2 season—begins 11/30/19
- 10-20% higher–the regular 4 season–begins 12/8/19
- 35-45% higher–the peak season–begins 12/13/19
- 60-70% higher–the holiday season–begins 12/20/19

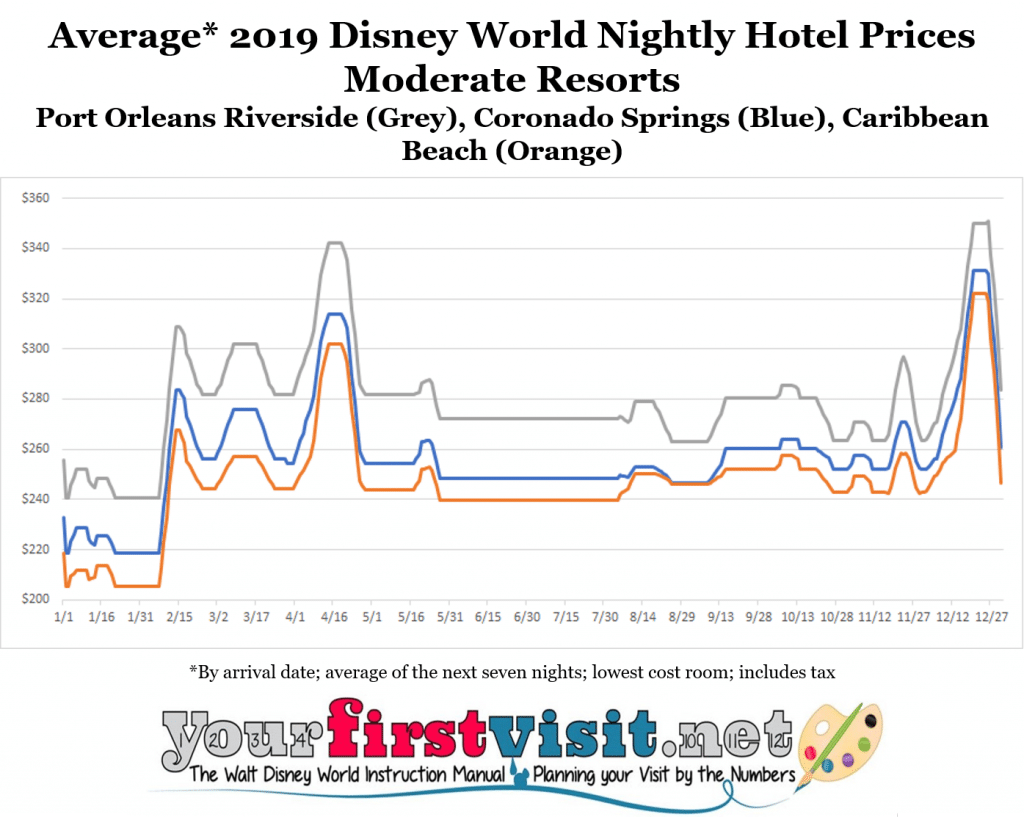
2019 DISNEY WORLD PRICE SEASONS: MODERATE RESORTS
- The lowest prices of the year–the value season–begin 1/2/2019
- 15% higher prices–Marathon rates–begin 1/10/19
- Lowest prices of year–the value season–begin 1/13/19
- 10-15% higher for the Martin Luther King Jr. long weekend begins 1/18/19
- Lowest prices of year–the value season–begin 1/21/19
- 35-45% higher for the long Presidents Day weekend begins 2/14/19
- 25% higher–the peak season–begins 2/18/19
- 20% higher–the regular season–begins 2/24/19
- 25% higher–the peak season–begins 3/8/19
- 20% higher–the regular season–begins 3/24/19
- 25% higher–the peak season–begins 4/7/19
- 40-45% higher–the Easter season–begins 4/14/19
- 15-20% higher–the regular season 2–begins 4/28/19
- 25-35% higher over the Memorial Day long weekend begins 5/24
- 14-17% higher–the summer season–begins 5/27/19
- 16-22% higher–the summer 2 season–begins 8/11/19
- 10-20% higher–the fall season–begins 8/25/19
- 15-25% higher–the regular 3 season–begins 9/15/19
- 25-35% higher over the long Columbus Day weekend begins 10/11/19
- 15-25% higher–the regular 3 season–begins 10/14/19
- 10-18% higher–the fall 2 season– begins 10/27/19
- 20-30% higher over the long Veterans Day weekend begins 11/8
- 10-18% higher–the fall 2 season–begins 11/11
- 20-25% higher over Thanksgiving begins 11/23/19
- 10-18% higher–the fall 2 season—begins 11/30/19
- 10-20% higher–the regular 4 season–begins 12/8/19
- 25-30% higher–the peak season–begins 12/13/19
- 45-55% higher–the holiday season–begins 12/20/19

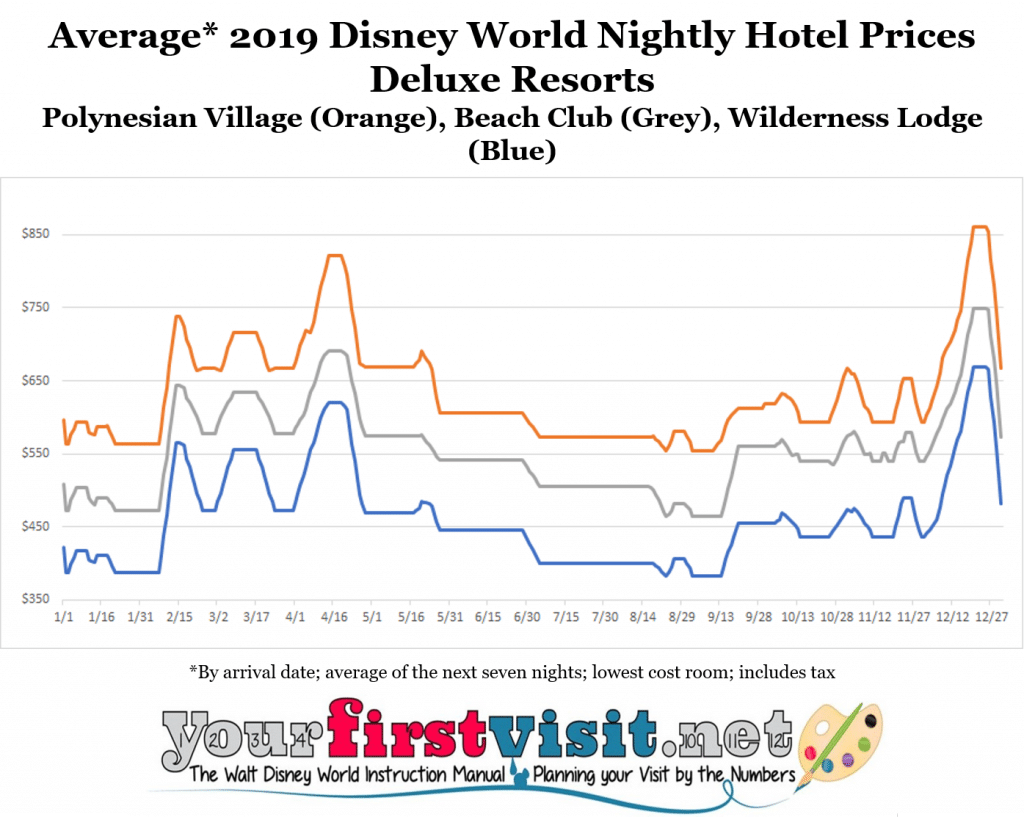
2019 DISNEY WORLD PRICE SEASONS: DELUXE RESORTS
- The lowest prices of the year–the value season–begin 1/2/2019
- 15-20% higher prices–Marathon rates–begin 1/10/19
- Lowest prices of year–the value season–begin 1/13/19
- 15-20% higher for the Martin Luther King Jr. long weekend begins 1/18/19
- Lowest prices of year–the value season–begin 1/21/19
- 40-55% higher for the long Presidents Day weekend begins 2/14/19
- 30-45% higher–the peak season–begins 2/18/19
- 20-25% higher–the regular season–begins 2/24/19
- 30-45% higher–the peak season–begins 3/8/19
- 20-25% higher–the regular season–begins 3/24/19
- 30-45% higher–the peak season–begins 4/7/19
- 50-60% higher–the Easter season–begins 4/14/19
- 20-25% higher–the regular season 2–begins 4/28/19
- 25-35 higher over the Memorial Day long weekend begins 5/24
- 10-17% higher–the summer season–begins 5/27/19
- 5-10% higher—near-lowest of year–the value season 2–begins 7/7/19
- Lowest of year–the value season—begins 8/23/19
- Prices bump up on 8/30/19 to 15% higher than the lowest of the year for the long Labor Day weekend
- Lowest of the year–the value season–begins 9/2/19
- 10-20% higher–the regular season 3–begins 9/20/19
- Prices increase to 25-30% higher than the lowest of the year for the long Columbus Day weekend on 10/11/19
- 5-15% higher–the fall season–begins 10/14/19
- 20-25% higher–the regular season 4–begins 11/1/19
- Prices go to 20-30% higher than the lowest of the year on 11/8 for the long Veterans Day weekend
- 5-15% higher–the fall season–begins 11/11/19
- 25-40% higher during Thanksgiving begins 11/26/19
- 5-15% higher–the fall season–begins 11/30/19
- 15-20% higher–the regular season 4–begins 12/8/19
- 30-45% higher–the peak season–begins 12/13/19
- 55-75% higher–the holiday season–begins 12/20/19

Follow yourfirstvisit.net on Facebook or Twitter or Pinterest!!
September 17, 2017 27 Comments