Category — p. News and Changes
Hey, Middle Class: You Really ARE Welcome at Disney World
“So, 30 years ago, Frank Wells asked me…when we were thinking of going from $16.50 to $18.50 [for park tickets]. He said, Jay, is this the ceiling on pricing?”
–Jay Rasulo, Chief Financial Officer, The Walt Disney Company, at the MoffettNathanson Media & Communications Summit, May 13, 2015
DESPITE INCREASING PRICES, DISNEY WORLD IS STILL AFFORDABLE

The most recent flowering has been claims that the middle class can’t afford Disney World at all. These include assertions that
- Disney World has “priced middle class families out”
- Disney World has “left the middle class behind”
- Disney World is “abandoning [the] middle class”
- Disney World has “set their prices at the top ten percent of family incomes”
- Disney World’s “outrageous prices” aimed at “the upper class” … “leave for everyone else … cheap-but-complex ticket deals for certain days, off-site lodging, or … just attending … Six Flags.”
OK, sorry Six Flags, but here’s the reality:
- A Disney World vacation is indeed eye-wateringly expensive (Wanna know how to blanch an almond? Show it Disney World ticket prices…)
- Disney World ticket, hotel and food prices have indeed been going up faster than median household incomes and the CPI for years now. Each time they do so, more middle class families are left out, and other middle class families have to save for longer to be able to afford a visit.
- Even so, a family of four can have a great vacation at Walt Disney World (and stay in a Disney World hotel while doing so) for $2,600 to $3,100, plus travel costs. Plenty of middle class families can’t afford that, but plenty of middle class families can.
The figure of $2,600 to $3,100, plus travel costs is based on
- Five days of park tickets—the minimum for a great visit, with two days at the Magic Kingdom and one day each at Disney World’s other three parks, at $1,350 total for four people. (The way Disney prices tickets, a 6th day in the parks—which I’d recommend—adds a total of $43 to this amount. You pay a shocking amount for the first few days at Disney World—after that, a day in a park is about the cost of a movie.)
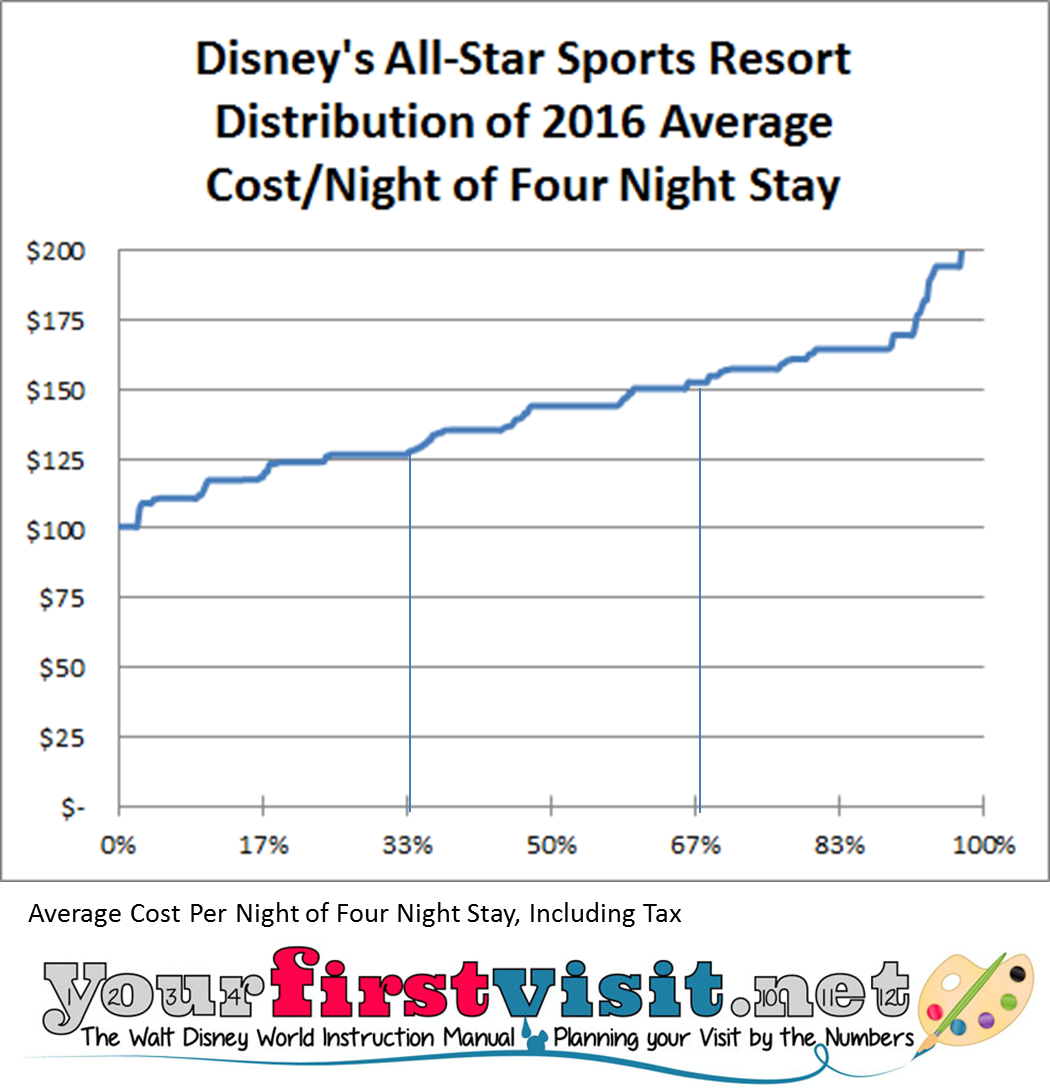
- Four or five nights in a standard room at one of Disney’s All-Star Resorts, which during two thirds of arrival dates in 2016 average $100 to $150 a night. Figure this as $500 to $750.
- Five days of food—your mileage will vary, but there are plenty of solid $15 dinners at every hotel and every park at Disney World. A range of $35-50 per person per day sums to another $700 to $1,000.
Since there’s no actual definition of the middle class, there’s no actual definition of its income range, either.
Reasonable people might use definitions that include household money income ranges of $20,000 to $105,000, $20,000 to $190,000, or $40,000 to $125,000–this last is the one that resonates with me. (All from this, although I had to interpolate one of the numbers.)
Whatever you define as the range of middle class incomes,
- Most households earning at the bottom of the middle class income distribution are clearly priced out of a Disney World vacation, and have been for decades. As the poet and philosopher George Clinton once sadly reflected, “Broke don’t travel
.”
- Just as clearly, many families higher in the middle class income distribution can afford $2,600 to $3,100, plus travel costs.
- Other families in the middle of the middle class income distribution have to scrimp and save to make a Disney World vacation work, and when prices go up even a little bit, their visits get tenuous. Danielle said this on my Facebook page: “So sad to me because [I] haven’t been in 25 years and finally saved enough to go for a family of 5. And now prices are still going up [so] it may not be possible for a lot of families to afford. 🙁 Everyone should be able to get to Disney at some point in their life.”
But I don’t think a vacation that can cost as little as $2,600 to $3,100, plus travel costs, can reasonably be argued as “pricing middle class families out” or “outrageously priced.”
Now if you read the largely ridiculous articles circulating around, you might be surprised by this. Aren’t the rooms at Disney World $2,000 a night? Isn’t dinner $115 a night just for a steak (and don’t forget taxes and the tip)?
Well, by my count Disney World does indeed own around 150 or so spaces that go for on the order of $2,000 a night or more—around 110 “Grand Villas,” 20 newly-opened “Bungalows” at the Polynesian, and the rest fancy multi-bay suites. (I have argued elsewhere, perhaps tongue-in-cheek, that the new Bungalows are aimed at the important President for Life/ dictator/ oligarch/ drug cartel jefe market segment…)
But it also offers around 9,000 rooms that are typically well under $200 a night, of which about 5,000 rooms are typically $150 or less.
The steak price was a comic error on the part of the writer, who perhaps was more concerned to be tendentious than accurate. But it has been true for years that you can pay an arm and two legs for dinner at Disney World…or you can pay about $15. And there’s a lot more places that serve dinner for $15 than cost an arm and a leg.
That you could spend tens of thousands of dollars on a Disney vacation does not mean that you must. When I shopped for a car last fall, the fact that cars existed that were 15 times as much as I could afford was irrelevant (except insofar as it gave me an excuse to read Dan Neil’s great reviews of them, with lines such as “Like very tight pants, these cars don’t always tell the story owners think they tell“). The cars I could not afford did not matter, and I am happy with the Hyundai that I could afford.
Can you put together a vacation budget of $3,000 over a year, or over several years? Then Disney World welcomes you.
The rest of this post is, I suppose, an analytic appendix to this key point—that many in the middle class can indeed afford Disney World.
TICKET PRICES
Many of the articles have focused on ticket price increases since Disney World opened in 1971. There are two problems with most of the presented analyses—although their overall conclusion that prices are rising faster than inflation or median household money income is dead-on.
One is that they focus on one day tickets, but no one who knows Disney World would recommend just a day there, there’s too much to see. Focusing on one day tickets understates the cost of a Disney World vacation. Five day (or longer) tickets are the appropriate unit of analysis. Five day tickets yield two days in the Magic Kingdom and one day at each of Disney’s three other theme parks, Epcot, the Animal Kingdom, and Disney’s Hollywood Studios–this is the minimum for a great trip.
Second is that they compare apples and oranges. What a ticket covered profoundly changed in the early 1980s, when the parks shifted from two sets of prices—one to get in, and a second to actually get on a ride–to an inclusive admission price that also included access to the rides.
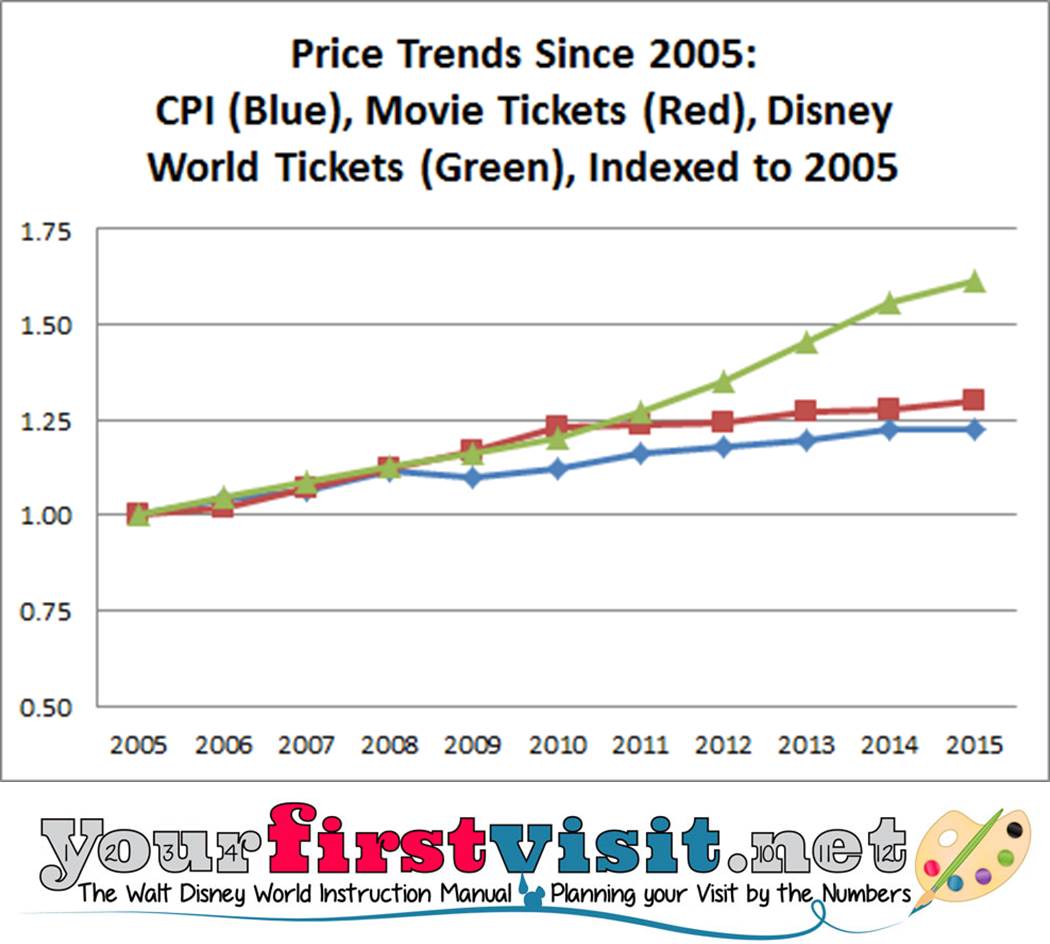
The current ticket format—“Magic Your Way” tickets—emerged in 2005. Below is the trend since 2005 in prices for 5 day Magic Your Way tickets, CPI, and, just because I could find it for a comparison, movie ticket prices.
You can see the major increases in ticket prices over inflation since 2008.
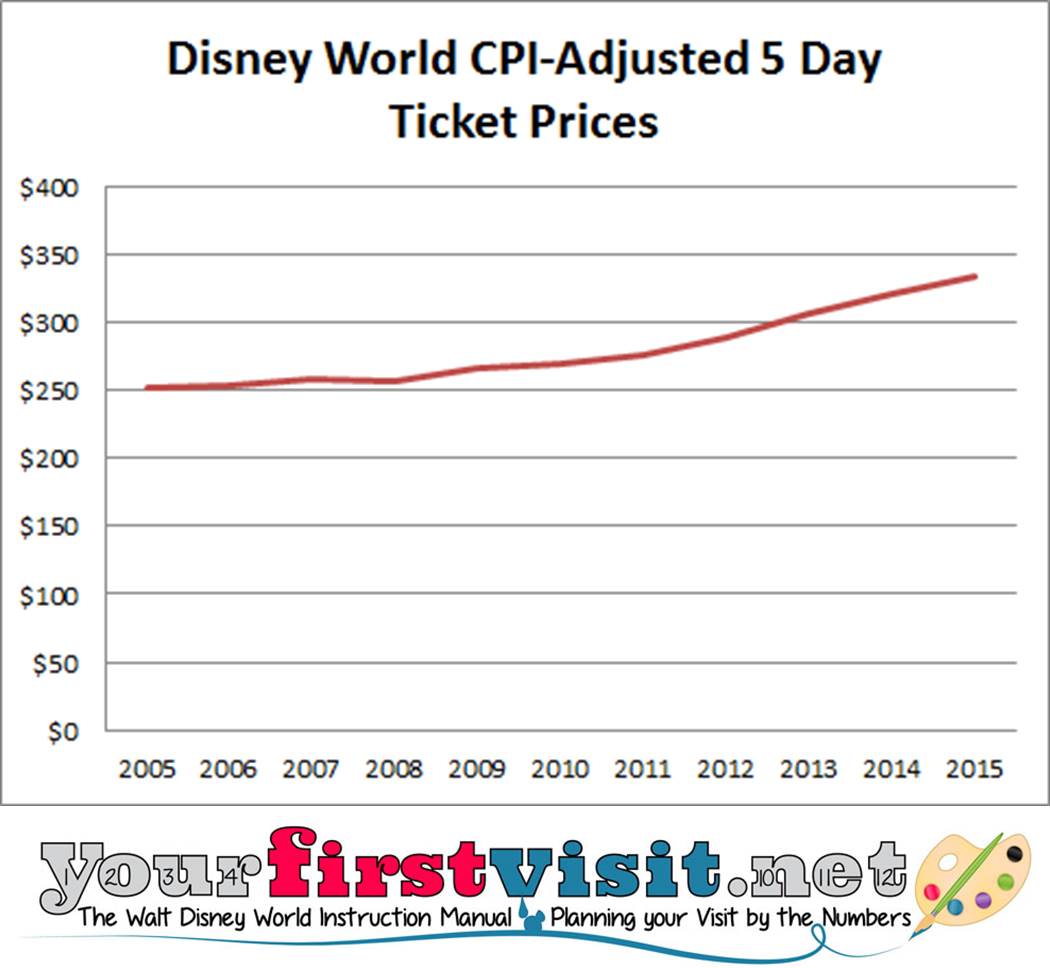
Inflating past ticket prices by the relevant CPI figures yields this inflation-adjusted chart of 5 day ticket prices:
You can see some “restraint” during the recession (there was even more than appears from this list-price chart, as there were some pretty wild discounts early in that period, such as seven hotel nights and seven tickets days for the price of four), and accelerating increases coming out of the recession.
In real terms, ticket prices for a five day trip have increased by about $80 per person since 2005 ($8/year, or $16 a park day)—or about $320 for a trip with a four person family.
This is not a trivial increase, and will require a longer savings period for some families, and indeed will shut out a slice of other families entirely.
But $300 more since 2005 is not enough to make Disney World “unaffordable to the middle class.”
One of the more comic claims made in the recent spate of articles is that Disney has “set their prices at the top ten percent of family incomes” The top ten percent of household incomes begins at about $150,000 a year. If you think a family below the top 10%–e.g. one that makes “just” $145,000 a year–can’t afford another $300 on ticket prices compared to 2005—well, then, to the barricades!
Although it may not seem that way on wildly crowded days like New Year’s Eve and the 4th of July, the parks at Disney World have limited capacity and excess demand.
It rations that demand through price increases, and even so has been seeing record attendance for a while now. This partly because, as Disney CFO Jay Rasulo noted at the May MoffettNathanson Media & Communications Summit, “we price on a value basis and we keep a very, very close check on what the value proposition is for our guests and the feedback they give us about the value of a day in one of our parks.”
ROOMS
Disney World rarely discounts ticket prices, but its hotel room prices both drop and increase multiple times over the year, and see in addition deal after deal over the course of the year (fewer, and with lower effective discounts, since the recession ended).
The best way to see trends in rooms is thus not to focus on list prices but rather on prices real people actually paid for Disney World’s 27,000-plus actual rooms.
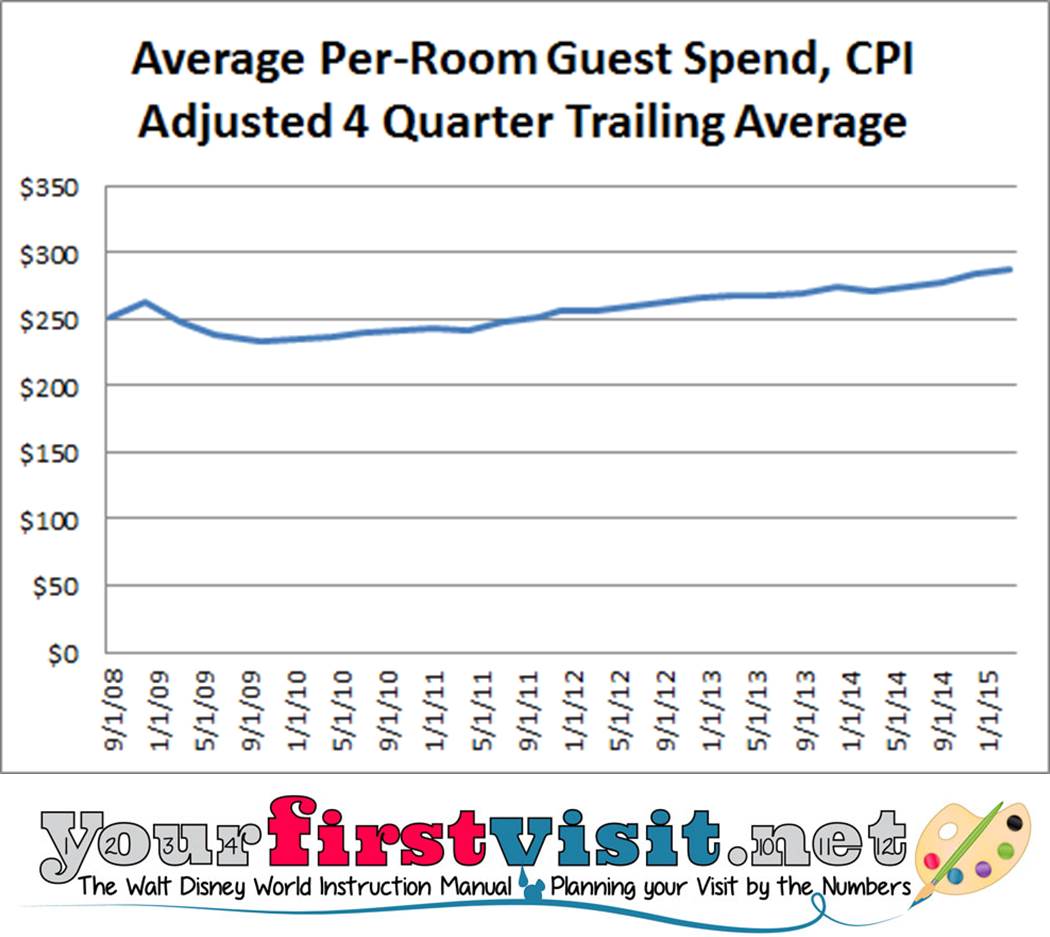
With a little math, you can construct this from data in Disney’s SEC filings. This math is the source of the following chart–with past prices inflated to CPI, and four quarter trailing moving averages used to smooth out seasonal prices and thus reveal pure trend:
What you see is realized prices dropping during the recession, and not hitting their pre-recessionary peak until late 2012. Since then they’ve gone up about $25/night in real terms compared to their pre-recessionary peak—or up $100 to $125 for a four or five night stay. (For the curious, un-adjusted charts are here.)
But doesn’t a price of almost $300 a night shut out the middle class? Well it might were that the only price, but it’s in fact the average price of a wide range of options among Disney’s 27,000 rooms.
Disney World has 9,000 rooms in its value resorts where standard room prices are much cheaper than $300 a night—and its last major hotel add, in 2012, was an expansion of these lower-priced rooms.
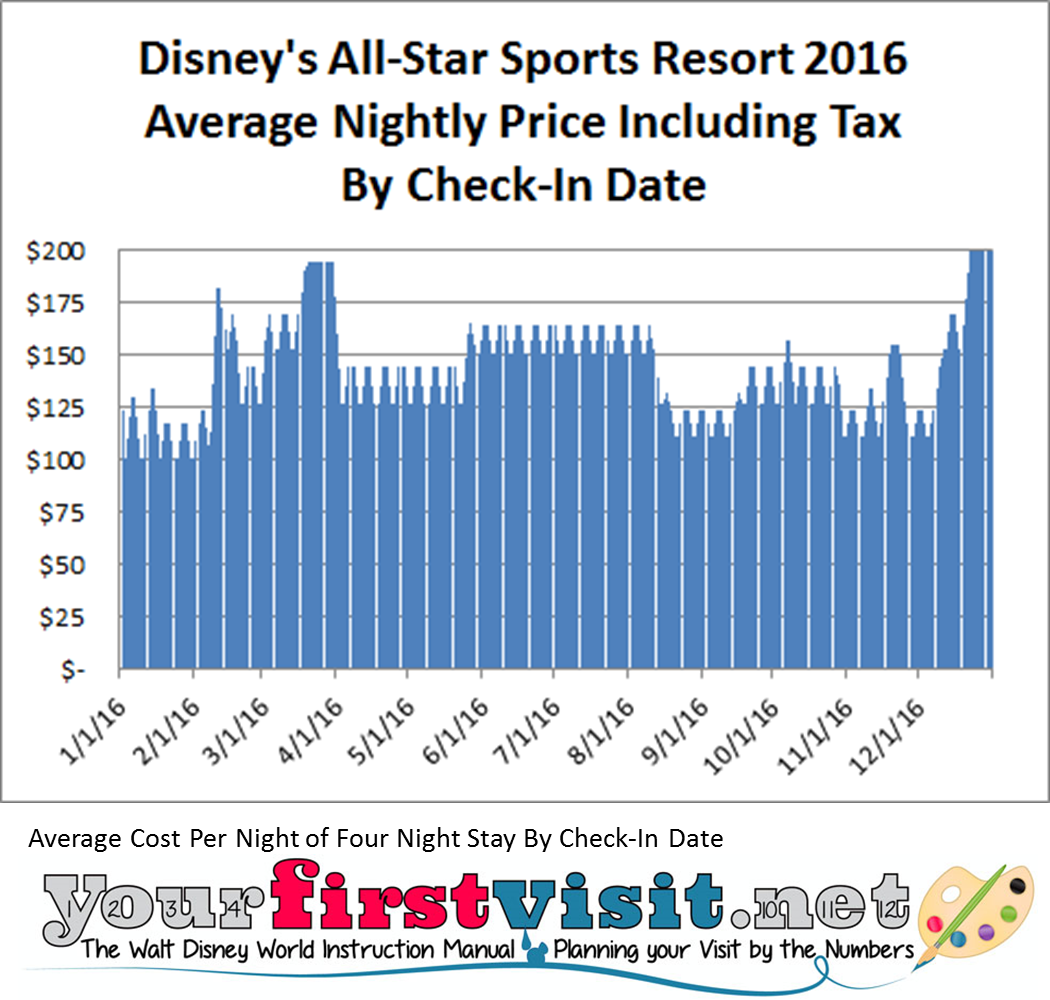
At the lowest-priced among these, the three All-Star Resorts, you can pay less than $125 a night many nights of the year for a standard room, and less than $150 most nights:
Because Disney manages hotel demand through pricing, the most highly-demanded nights of the year will see higher prices than $150. But if you rank order the average nightly cost of a four night stay in a standard room at, for example, All-Star Sports, you’ll see that a third of 2016 arrival dates are available for $125/night or less, and two thirds at $150 or less:
As I noted last week, many Disney hotel rooms saw major—sometimes astonishing–price increases for 2016.
But the All-Stars showed no increases most seasons—that’s a price cut in real terms. Moderate resort Caribbean Beach saw increases at just CPI—that’s a “no increase” after inflation—and standard rooms at the deluxe resort Wilderness Lodge also saw no price increase most seasons in 2016—again, a price cut in real terms.
Other Disney World hotels saw much higher price increases. But your family doesn’t have to choose them. The middle class can still afford the All-Star Resorts, many easily so, and in fact most times of the year will pay less in 2016, after inflation, than in 2015.
THE VARIABLE PRICING SURVEY
One of the odder things about the recent spate of silly articles was that they came out not based on any particular relevant recent pricing event. Ticket prices had gone up in February, and 2016 room rate increases had not yet been announced.
My guess is that all this was inspired by facts that were true but irrelevant (20 new rooms that go for $2,000 a night among Disney World’s 27,000 other rooms that go for less—usually MUCH less), facts that were untrue and irrelevant—the putative $115 steak—and a survey.
Yes, a survey. Disney recently released multiple surveys to test reaction to variable pricing of its park tickets—charging more for more popular dates and less than that for less popular dates. (The line at the beginning of this post that the middle class has been relegated to “cheap-but-complex ticket deals for certain days” likely came from a confusion between these survey questions and reality.)
All these surveys showed current ticket prices for less popular dates, and higher prices for more popular ones—that is, on average a price increase. Some of these surveys also showed additional new ways to price multi-day tickets, and in the case of one of these, you could infer the doubling of the price of some multi-day tickets.
Well, folks, you heard it here first: Disney isn’t suddenly doubling ticket prices this year, or anytime soon.
Moreover, if the surveys didn’t all show either current or higher prices, then the Disney fan community—sometimes characterized more by volubility than good judgment—would have been agog with the claim “Disney is cutting some ticket prices!” That’s not gonna happen, either.
Third, Disney World does all kinds of surveys, all the time. Most turn into nothing. From my co-author Josh:
Fourth, as I’ve noted before, it would actually be a great thing—even for the middle class—if Disney reduced attendance the most crowded days of the year by shifting to variable prices, and then using increased prices to better fit capacity to demand those dates.
On New Year’s Eve at Epcot last year some people waited five hours for some rides. Five hours.
Those five hour waits fell on the just and unjust alike, so peasants, the proletariat, the petite bourgeoisie, and the nobility can all agree with fervor that spending five hours waiting for one ride is simply not to be borne. Viva la revolucion!
Follow yourfirstvisit.net on Facebook or Google+ or Twitter or Pinterest!!
June 30, 2015 15 Comments
Revised 2016 Disney World Crowd Calendar, Price Seasons, and Week Rankings
DISNEY WORLD 2016 PLANNING TOOLS

Based on my completed analysis of 2016 public school breaks (covering 12.4 million kids from almost 200 school districts), I’ve updated my 2016 Disney World crowd calendar.
No week had its crowd ranking changed by more than one point on my 1-11 point scale, and no week changed “class”–that is all the former green weeks are still green, all red still red, etc. Changes are all within classes– “Low” to “Low-Plus,” “High” to “High-Minus”, etc.
Disney’s 2016 prices came out a week ago, and these are now fully updated in my 2016 Disney World Price Seasons, which until then had been projections.
Disney World made major price season changes at the values and moderates from mid-August 2016 until almost the end of October 2016. As a result of particularly large increases in the second half of this period, many projected “Low” price weeks shifted into “Moderate” prices in the second half of September and October.
The combined effects of crowd and price changes led to a number of weeks shifting ranks in my 2016 Disney World Week Rankings. My week rankings are aimed at first-timers who may never return, and are based on first chunking weeks by attractiveness, then, within chunks, sorting by first crowds, then prices. (More detail on how the week rankings are constructed is here. The story at the link is about 2015, not 2016, but the principles are eternal.)
However, no week changed class. For example, all previously recommended weeks are still recommended, all weeks that used to be “not so keen” are still classed as “not so keen,” etc. What’s changed is position within the classes.
In general, there’s nothing in these revisions to make you rethink a week you’d already targeted with one exception. If you were targeting later September or October based on traditional prices at the moderates or values, note that prices have gone up a lot these weeks. For example, compared to the same weeks in 2015, Little Mermaid rooms at Art of Animation are up 17%, All-Star Sports up 16%, Caribbean Beach up 7%, Riverside and French Quarter up 12%.
Follow yourfirstvisit.net on Facebook or Google+ or Twitter or Pinterest!!
June 29, 2015 6 Comments
Breaking: Armed Forces Salute Extended Into December
Steve Bell is breaking the news that the Armed Forces Salute has been extended “to 20 December 2015 for Disney Armed Forces Salute Tickets and 23 December 2015 for Room Discounts.”
See Steve’s material here for important details!
Friend of the site Kelly B can book Armed Forces Salute room discounts. Contact her at 980-429-4499 or kellyb@destinationsinflorida.com.
Kelly not only will book your trip, but also help you (for free) with
- Itinerary planning, including advising on and booking your FastPass+
- Dining suggestions and reservation planning
- Future discount searches – Ongoing searching for future discounts to apply to your vacation
- Free “Mouse Perks” – tips, updates, and fun freebies
And, for qualifying trips Kelly and her agency, Destinations in Florida, will get you a free copy of The easy Guide to Your First Walt Disney World Visit, the best-reviewed Disney World guidebook in history, after it comes out later this year!
Kelly cannot book Armed Forces Salute tickets–just the room deals.
Follow yourfirstvisit.net on Facebook or Google+ or Twitter or Pinterest!!
June 26, 2015 No Comments
Many Disney World Resorts Show Major Price Increases for 2016

- Major increases in value and moderate prices from later August 2016 through most of October from a shift in price seasons. Significantly higher prices across the year at Art of Animation Little Mermaid rooms and Finding Nemo family suites, and at Port Orleans French Quarter and Port Orleans Riverside.
- Major increases—10% to more than 15%–in many deluxe resort room types in 2016, although some show little increase and others show increases more in the 4-8% range.
Analyzing Disney resort price changes is difficult—there’s more than 20 hotels, many differently-priced room and view types within them, seven to nine different price seasons over the course of the year, additional weekend and holiday upcharges, and more.
As a result, unless you have a LOT of time on your hands you need to sample, and that’s what I’ve done. In general I sample the lowest-priced rooms at most of the resorts (with some exceptions that are noted below) and analyze:
- Season price increases across all the major Disney World price seasons—e.g. “Regular” season prices for 2016 compared to 2015
- Changes in the dates covered by price seasons that have an impact on price levels—there’s a lot of that in 2016
- Changes in the relative price levels of hotels in a single price class—there’s some of that in 2016
DISNEY WORLD VALUE RESORTS PRICING IN 2016
Price season structure changes
In a major change, 2016 price seasons for later August through the end of October have changed, from the old “Value 2” to “Fall” in later August and earlier September, and from “Fall” to “Regular” from mid-September to almost the end of October.
In both cases the switch is from a lower-priced season to a higher priced season. When combined with general season price increases, example effects include:
- In the first part of the period, with the shift from “Value 2” to “Fall”: for standard rooms, compared to same dates in 2015, Little Mermaid rooms at Art of Animation are up 13%, Pop Century is up 6%, and the All-Stars are up 7%.
- In the later part of the period, later September and most of October 2016 (excluding holiday weekends), with the shift from “Fall” to “Regular,” compared to same dates in 2015: standard Little Mermaid rooms at Art of Animation are up 17%, Pop Century is up 15%, and the All-Stars are up 16%.
Earlier in the year, two short periods are now “Regular” that used to be “Value” or “Value 2”—February 7 through February 10, and August 14 through August 18.
Price level changes
The basic pattern among value resort standard rooms of Art of Animation Little Mermaid rooms being most expensive and the All-Stars being least expensive continues in 2016.
Art of Animation rooms show the highest price increases among these standard rooms in 2016, and the All-Stars the lowest, extending this gap, and putting Little Mermaid rooms shockingly close to standard moderate room prices some dates.
The three Family Suite areas at Art of Animation—Finding Nemo, Cars, and Lion King—have had the same prices. In 2016, Finding Nemo suites are more expensive than the other two, which are priced the same.
Season price increases
Most price seasons the All-Stars standard rooms show no changes vs 2015—considering inflation, that’s in effect a price cut. The exceptions are the Value and Regular Seasons, which have 3-5% increases. Family Suites at Music are unchanged in some major seasons and go up 1 or 2% in others.
Pop Century standard rooms have no price increases for the Summer or Fall seasons in 2016, and increases of 2-4% in the other seasons, with the Value season seeing the highest increase.
Little Mermaid rooms are up across the board 3-5% in the major seasons (a little less in the shorter Easter and Holiday seasons). Value, Fall and Regular show around 5% increases.
Art of Animation suites at Cars and Lion King are up 1 to 3% most seasons (Peak is unchanged). Nemo Suites are up 4 to 7% in the major seasons, with the Value season seeing the highest increase.
DISNEY WORLD MODERATE RESORTS PRICING IN 2016
Price season structure
The moderates see the same price season structure changes in 2016 as the value resorts do—short new Regular periods in February and early August that replace old Value or Value 2 seasons, and the major swap of Fall for Value 2 in later August and early September, and Regular for Fall in later September and most of October.
The effect from later August through most of October is that Caribbean Beach standard rooms are up 7-8%, and Port Orleans Riverside and French Quarter standard rooms up 12%.
Price level changes
Until 2016, Caribbean Beach, Port Orleans French Quarter, and Port Orleans Riverside standard rooms had the same prices, while Coronado Springs has tracked them some nights and other nights was $3-5 more.
In a major change, in 2016 Riverside and French Quarter are now the most expensive moderates.
More specifically, in 2016 for standard rooms Caribbean Beach is now generally the least expensive option, then at on average 2% more is Coronado Springs, then at on average about 4.5% more (or 2.5% more than Coronado Springs) are the two Port Orleans Resorts, Riverside and French Quarter.
Season price increases
Caribbean Beach shows 1-3% increases across most price seasons, with Peak a little less and Value showing the highest increase. Port Orleans Riverside and French Quarter show increases of 5-8%, with the highest increase being in Value season.
DISNEY WORLD DELUXE RESORTS PRICING IN 2016
Price season structure
The deluxe resorts run to a different price season calendar than the values and moderates, especially mid-July through October, and show little difference to this schedule in 2016, especially compared to the major changes at the values and moderates from mid-August through most of October.
The only significant changes I saw were two new instances of Regular season, both in effect price increases. February 7 to 10 is now Regular instead of Value, and November 4-12 is now Regular instead of Fall.
Price level changes
There’s a bewildering plethora of price points at the deluxes—many view options, some with “Club” service options as well. I only sampled the full set of price changes in seventeen deluxe room types, and based on that saw only one material change among the overall resort price standings.
The Grand Floridian is still the most expensive, and standard rooms at the Wilderness Lodge are still the least expensive.
However, traditionally Animal Kingdom Lodge standard rooms have been very close to the prices of standard Wilderness Lodge rooms, but in 2016 Wilderness Lodge standard rooms see hardly any increases, while Animal Kingdom Lodge standard rooms are up 7-12% in all the major seasons except Fall. So more daylight is emerging between the two Lodges whose cheapest rooms used to be near-equivalent in price.
Season price increases
As noted, standard Wilderness Lodge rooms see no price changes among most of the major price reasons—after inflation, a price cut. The exception is Value 2, which is 6% higher. Courtyard view rooms at the Lodge show no to small increases in many seasons, but prices are up 10% in the Value, Value 2, and Summer seasons. Woods view rooms at the Lodge show 10%+ increases in many major seasons–Value, Value 2, Regular, and Summer.
Animal Kingdom Lodge standard room prices are up only a bit in a few seasons, including Fall, but up 7-12% in many major seasons, including Value, Value 2, Regular, and Summer. Savanna view room prices show large increases across all seasons, from 9 to 17%, with the two Value seasons seeing the largest increases.
Beach Club standard rooms are up from just a bit to 6% in the major seasons, with the biggest increase in Value 2. Garden view rooms at the Beach Club are up 5-7% in the major seasons, with the highest increase in the value season.
Yacht Club standard rooms have the same prices as those at the Beach Club, so too are up from just a bit to 6% in the major seasons, with the biggest increase in Value 2. Garden view rooms at the Yacht Club are a little cheaper than their Beach Club equivalents, and are up around 7% in all the major seasons.
BoardWalk Inn standard rooms show price increases of 4-7%, with the highest increases among the major seasons in the two Value seasons. Water view rooms at the Boardwalk Inn are up 4% in all seasons except Value 2, which sees a 6% increase.
Polynesian standard rooms show increases of 3% to 8% in the major seasons, with the Regular season seeing the largest increase. Lagoon view rooms are up 1-2% in most major seasons, but up 5-6% in the Regular 2 and Value 2 seasons.
At the Contemporary Resort, both Bay Lake view and Magic Kingdom view tower rooms show a consistent 7% increase across the seasons.
Grand Floridian standard rooms have increases of 10 to 12% in the major seasons. Lagoon view rooms here see much lower increases, 3-7% in most major seasons, but just 1% in the Regular season.
MORE ON THE DISNEY WORLD RESORTS
I’ve stayed in more than 100 different Disney World rooms, suites, villas, and such. Reviews resulting from these stays are linked to here.
Follow yourfirstvisit.net on Facebook or Google+ or Twitter or Pinterest!!
June 25, 2015 11 Comments
Riverside and French Quarter Most Expensive Moderates in 2016
I’m still working my way through the data, but Disney’s 2016 resort prices show more differences among moderate resort prices than we’ve seen in the past.
For moderate standard rooms in 2016, Caribbean Beach is now generally the least expensive option, then at on average 2% more is Coronado Springs, then at on average about 4.5% more (or 2.5% more than Coronado Springs) are the two Port Orleans Resorts, Riverside and French Quarter.
Caribbean Beach standard room prices went up (on average across price seasons) about 1.5% for 2016 compared to 2015, so this is in effect an average price increase for Riverside and French Quarter of 6%.
Prices are up much more in later September and October because of the 2016 price season switch from Fall to Regular.
The later September and October 2016 prices for Riverside and French Quarter compared to the same dates in 2015 net out to an increase of almost 12%–or about $180 more over a seven night standard room stay.
Follow yourfirstvisit.net on Facebook or Google+ or Twitter or Pinterest!!
June 23, 2015 No Comments
2016 “Fall” Season Changes at Disney World’s Values and Moderates
I’m still working through the 2016 resort prices released today, but it looks like the “Fall” season at the moderates and values (but not the deluxes) has profoundly changed in 2016.
In 2015, it runs from 9/11 through 12/10 (with up-charges over Thanksgiving week and holiday weekends).
In 2016, in contrast, the first part of what in 2015 was Fall season has the same (higher) prices as Regular season. These dates where old Fall is now Regular are 9/18/2016 through 10/29/2016, with holiday weekend upcharges.
Then in November prices drop to the same levels as late August, and stay at this lower level (except holiday weekends and Thanksgiving week through December 10.
However, the later August/November/early December prices are higher than the later August prices we’ve seen recently and in 2015.
For example, in 2015 later August “Value 2” is about 5% higher than “Value” at both the moderates and the values. In 2016, late August/November/early December prices are about 11% higher at the moderates and 13% higher at the values than value season prices.
So it seems that the old August “Value 2” has been replaced by “Fall,” which then restarts not in September but rather the end of October.
Moreover, Port Orleans Riverside and French Quarter had an extra price increase making them the most expensive of the traditional moderates.
Here’s some specific price changes at some value and moderate standard rooms:
Later August and earlier September 2016:
- Shift from “Value 2” to “Fall.” Compared to same dates in 2015, Little Mermaid rooms at Art of Animation up 13%, All-Star Sports up 7%, Caribbean Beach up 8%, Riverside and French Quarter up 12%.
Later September and most of October 2016 (excluding holiday weekends):
- Shift from “Fall” to “Regular.” Compared to same dates in 2015, Little Mermaid rooms at Art of Animation up 17%, All-Star Sports up 16%, Caribbean Beach up 7%, Riverside and French Quarter up 12%.
Very end of October into early December 2016 (excluding holiday weekends and Thanksgiving week):
- Still “Fall.” Compared to same dates in 2015, Little Mermaid rooms at Art of Animation up 5%, All-Star Sports up 1%, Caribbean Beach up 2%, Riverside and French Quarter up 5%.
I still have a lot of work to do to figure this all out…But compared to prior years and 2015, the revised 2016 price seasons and how much rooms cost in the late summer and early fall compared to last year suggests not so advantageous prices from later August through October in 2016 at the values and moderates.
Follow yourfirstvisit.net on Facebook or Google+ or Twitter or Pinterest!!
June 22, 2015 5 Comments

