
$2.5 Billion in Disney Hotel Revenue, But Still No Coffee Makers in All-Star Movies
By Dave Shute
Disney’s late summer and fall Free Dining and late summer room discount deals came out about two weeks ago.

The universal experience, so far as I can tell, is that even though more rooms opened for booking into the deal May 9, many fewer standard rooms were available for these offers—especially free dining at the moderates–than we’ve seen in the recent past.
Moreover, 2015’s free dining deal saw a new requirement: families had to add Park Hopper or Water Park and More add-ons to their (always previously required) base tickets to even get free dining.
For those who had not planned to buy these add-ons, that’ll cost a family of four more than $270 extra, and will, for those ten or older, blow a night of savings on the free regular dining plan or almost two nights on the free quick-service plan. Results are even worse for kids 3 to 9.
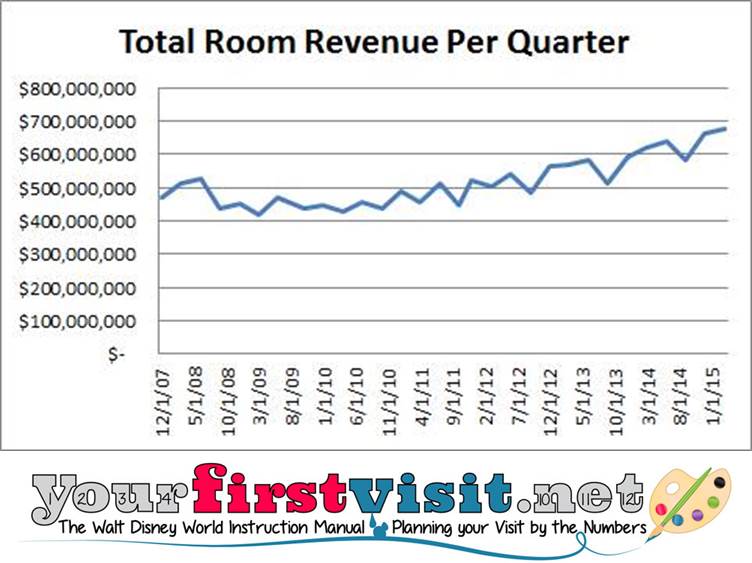
So what’s up? Well, what’s up is that Disney doesn’t need to discount so much anymore. See the chart:
Hotel revenues the last four quarters were more than $2.5 billion, including the first-ever two straight $650 million+ quarters. And despite major net capacity adds since the recession (Kidani Village, Bay Lake Tower, Grand Floridian Villas, Art of Animation), occupancy is running at levels not seen for years.
You will see some people who have not done the math—or don’t know what Sarbanes-Oxley means—saying that Disney is fudging this occupancy. But every quarter’s SEC filings include this at the end: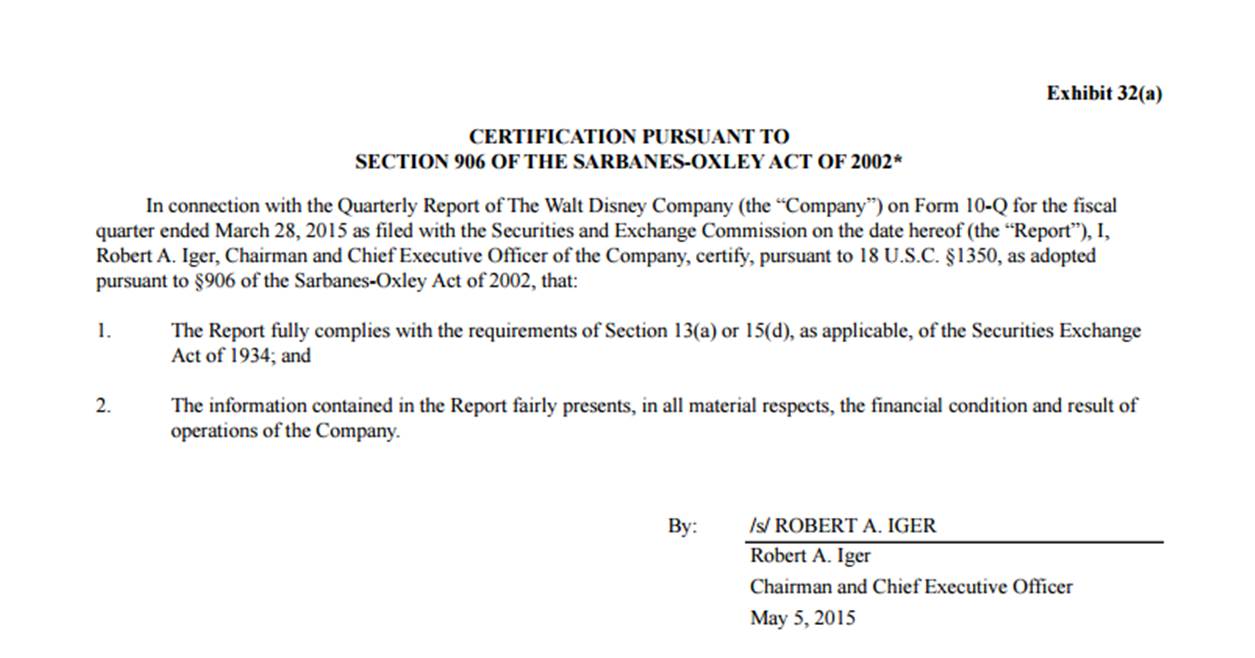
…and they also include something like this data:
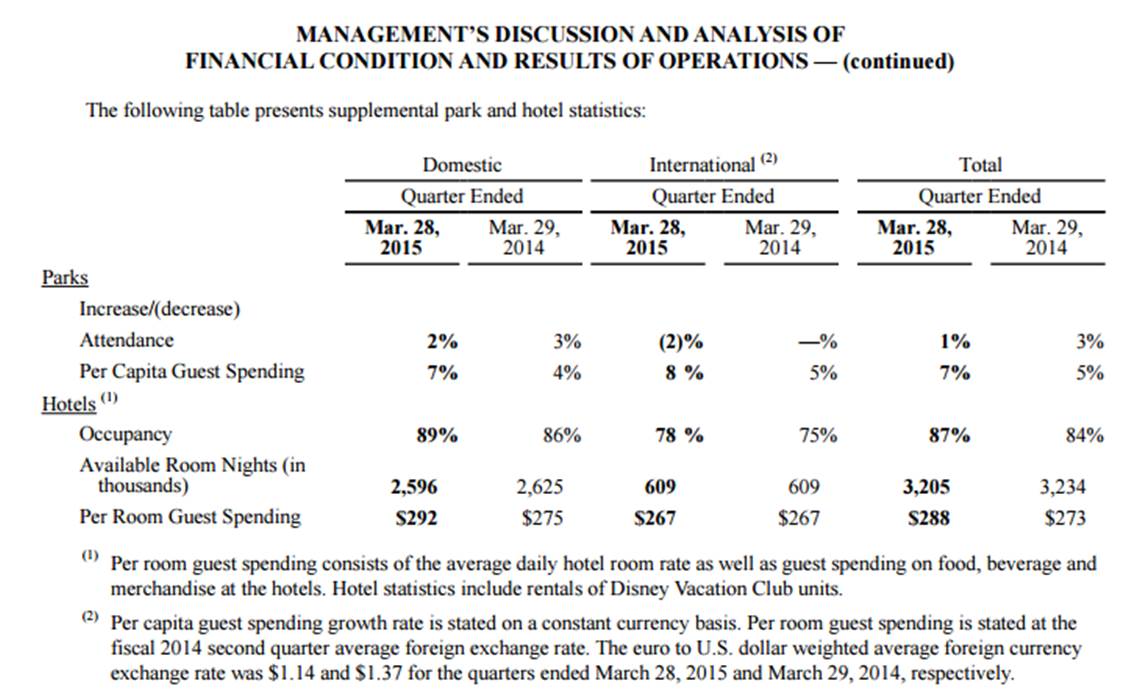
You can understand almost everything about trends in the competitive position of Disney’s hotels from this data, with a little work.
The only thing that’s tricky is that not all quarters are the same length (most, but not all, are 91 days) so to get fair trend comparisons you should convert into “per night” figures instead of “per quarter” stuff (you also have do some arithmetic to tease Q4 out of the FY’s 10-K).
It’s then a pretty straightforward analytic task to turn this into relevant trend data, using where needed four quarter trailing moving averages to accommodate the major seasonality in prices and occupancy that Disney faces.
So here’s the results. (All are for Disney’s total domestic resorts—you can’t separate California and Florida. But there’s so few rooms in the three California hotels that it doesn’t much matter.)
Available rooms. Disney reports available rooms per quarter in thousands (again, subject to the penalties of Sarbanes-Oxley, so no fudging). Converted to available rooms per night, here’s the facts over the past years:
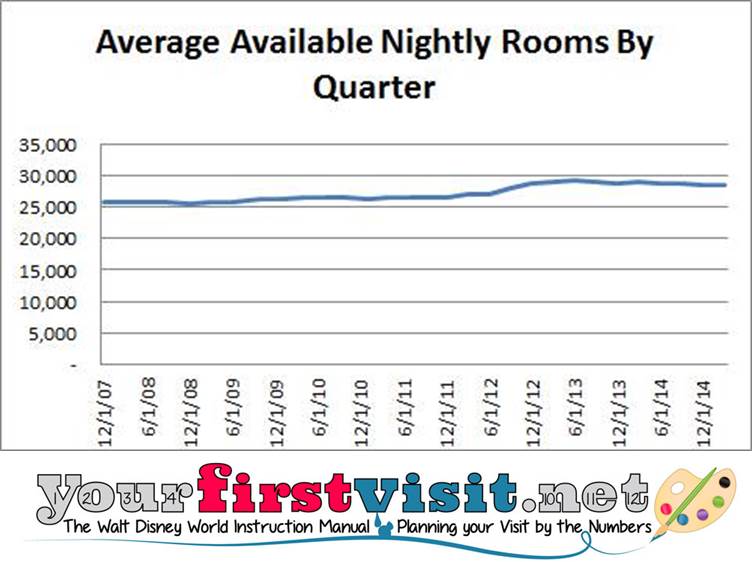
You see the kick up from the phased opening at Art of Animation in the second half of 2012, and then a slight trend down from various refurbs/conversions—especially at the Polynesian and Caribbean Beach.
But the down-trend is just not that big a deal. Available rooms peaked in Q3 2013 (roughly, April-June) at 29,154 per night, and in the last reported quarter (Q2 for fiscal 2015, roughly January-March) stood at 28,527.
That’s a difference of just 627 rooms per night, or about 2% compared to peak availability.
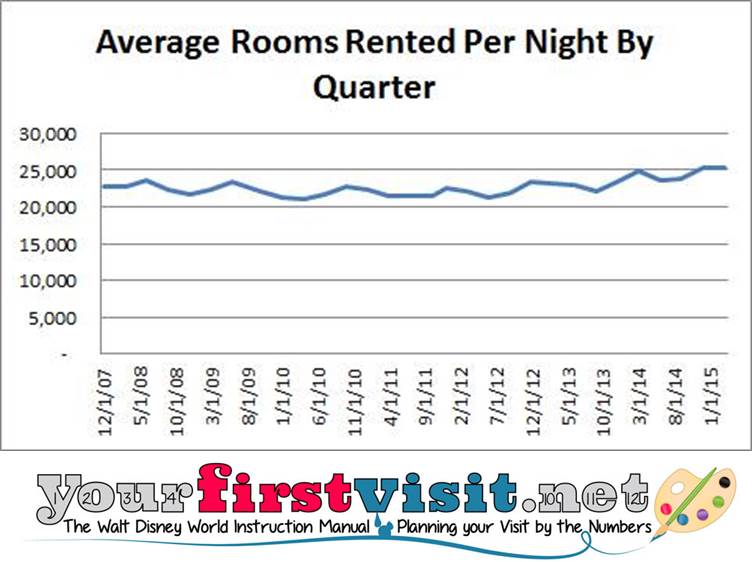
Rooms booked per night. Of more interest is rooms booked per night, which dropped to less than 21,000 rooms per night in Q2 2010 but in both the last two quarters exceeded 25,000 per night.
(Renting another 4,000 rooms per night is worth more than a million dollars of revenue a day to Disney.)
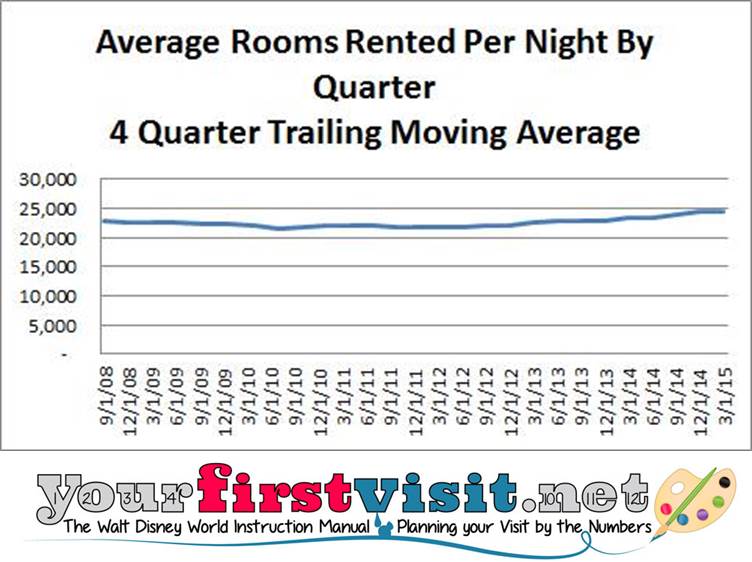
The upward trend is apparent, but so is the seasonality of these results. Showing a four-quarter trailing moving average cleans out seasonality to show pure trend:
Dividing rooms booked per quarter by rooms available per quarter is where the “occupancy” figures come from. And multiplying rooms booked per quarter by average per-room guest spend gives you revenues.
Per room guest spend.
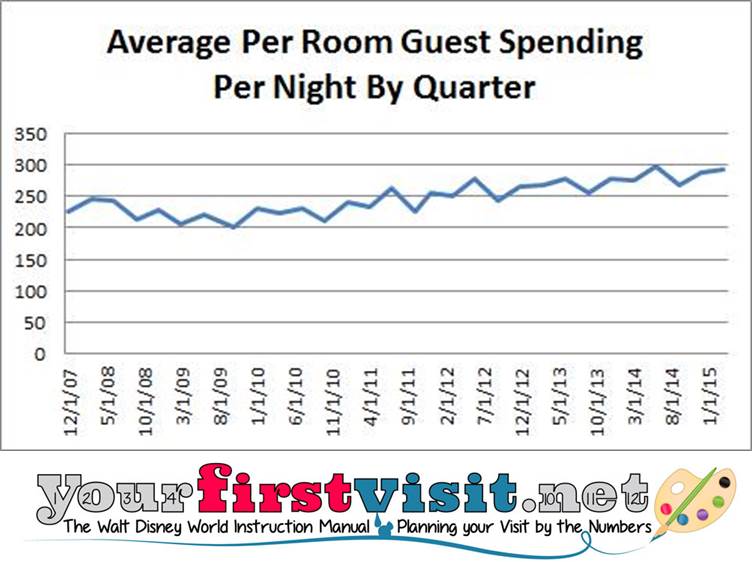
Above is the per room guest spend by quarter…
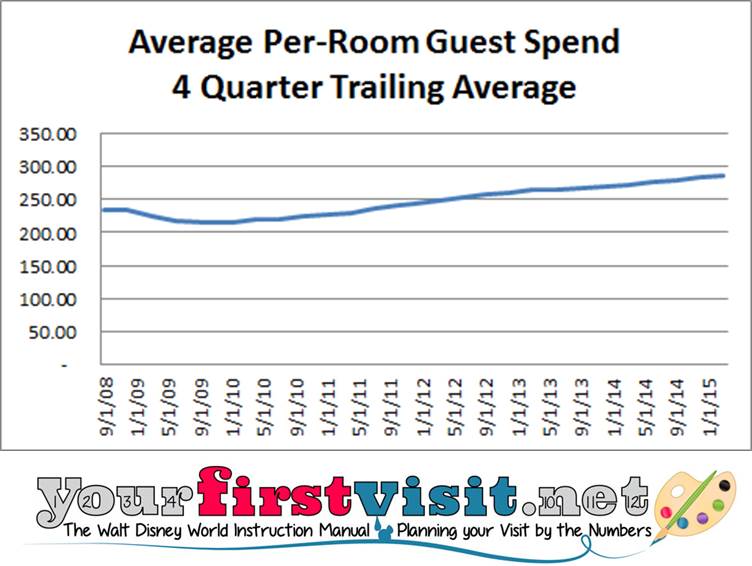
…and as a moving average, so you can see the trend without seasonality. (This particular moving average is not an arithmetic average of the 4 reported numbers, but rather weights them by the number of rooms booked each quarter.)
The overall per room guest spend is going up as a combination of increased prices, reduced total discounts, better revenue management (Disney has focused a lot on this lately) and increased guest willingness to spend on extras.
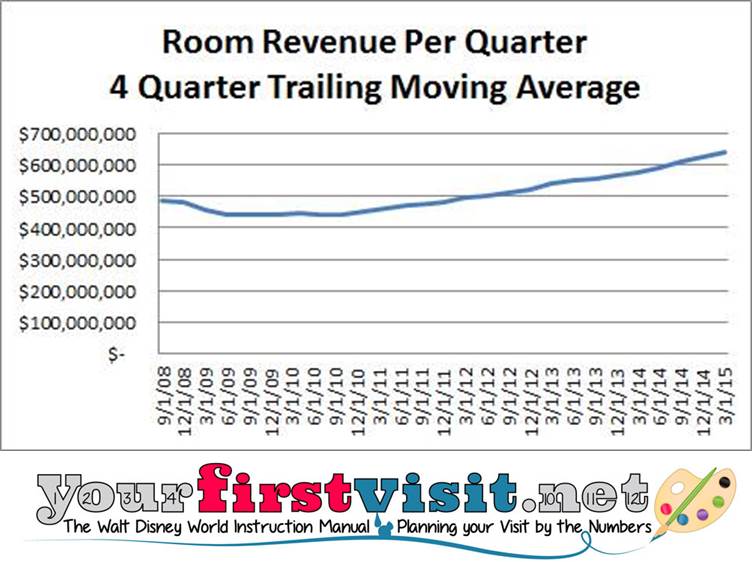
Total room revenue. Multiplying per room spend by rooms booked gives you hotel revenue.
Here’s the results–note it bottoming towards $400 million in the depths of the recession, and heading for $700 million the last two quarters…
…and as a four quarter moving average:
So the reason the Free Dining is so hard to get, and is more expensive than it used to be, is the same as why some hotels are rarely offered as part of the deal anyway, or why there are still no coffee-makers in value resort standard rooms (I really needed one at my stay in All-Star Movies last week): Disney does not need to offer them to get the kind of results it is looking for.
And the future of Free Dining? Well, as long as results are this strong, I don’t see anything more in the future than it being as hard, or even harder, to get as it was this time.
Follow yourfirstvisit.net on Facebook or Google+ or Twitter or Pinterest!!

4 comments
It was definitely crazy the day it released. Wow! But those who didn’t get it should check again – Right Now! Hurry, people! I’m not sure when it happened, but I noticed yesterday and today that several options for free dining were available on Disney’s site for my November travel dates. After I noticed yesterday, I contacted my TA and she was able to modify my reservation to match the same room type as my in laws (hoping for connecting rooms). It took her all of 2 minutes. Maybe, just maybe, someone will read this and benefit from it! Happy Disney Planning, everyone!
Yup, Valerie, a bunch more rooms opened up May 9!!
Yup, snagged Caribbean Beach Resort for my family of 5 (the only moderate resort w/FD that allows for 5 in a room) and even got a second one to think about. The second one is Art of Animation, for $600 more and only QS Free Dining. Thoughts on which we should go with? Still leaning toward CBR even though it’ll be our first time visiting for our girls. DDP for free is just too tempting.
DJ, it’s hard for me to recommend as I don’t know how you’d otherwise use the extra money!! If you expect to spend a lot of time in the room, and you’d otherwise just waste the money you’d save on something like a donation towards world peace, then I’d consider AofA. The extra space, bath, and privacy can be a godsend…
Leave a Comment | Ask a Question | Note a Problem