Category — d. Where to Stay at Walt Disney World
Dining at Port Orleans French Quarter
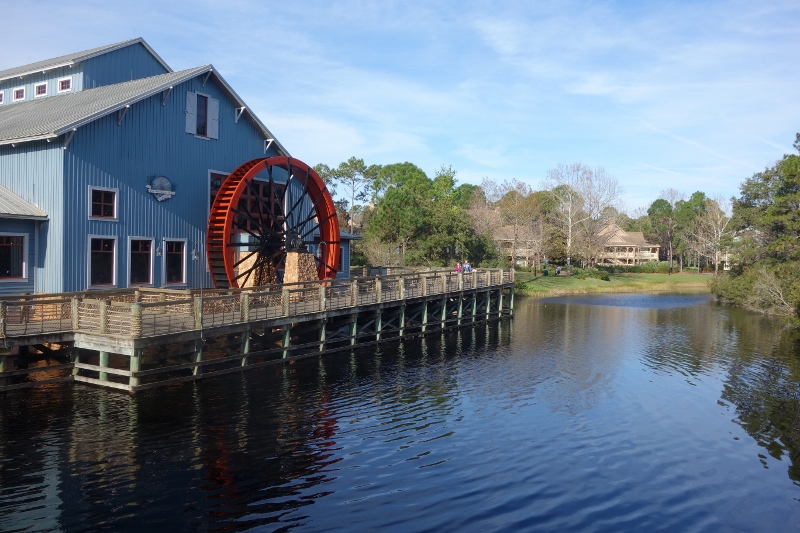
Earlier this summer the food court at Port Orleans French Quarter closed for refurb.
I dropped in at the beginning of this month to see in person the alternatives.
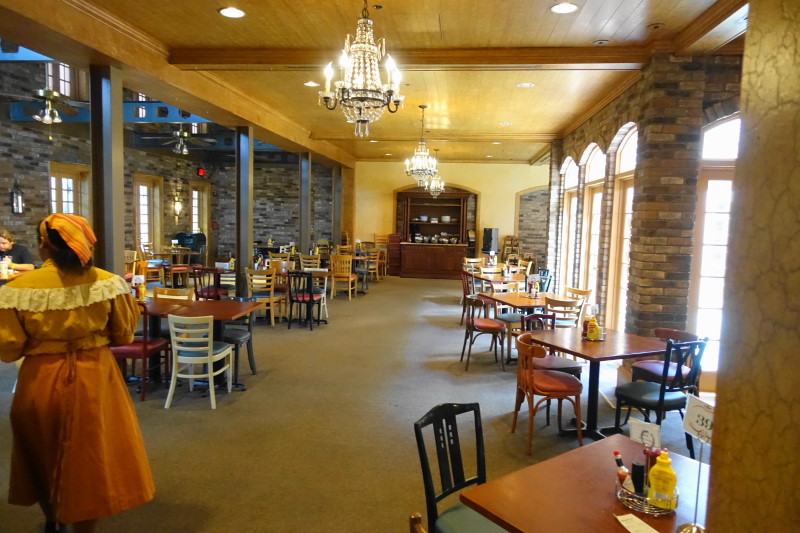
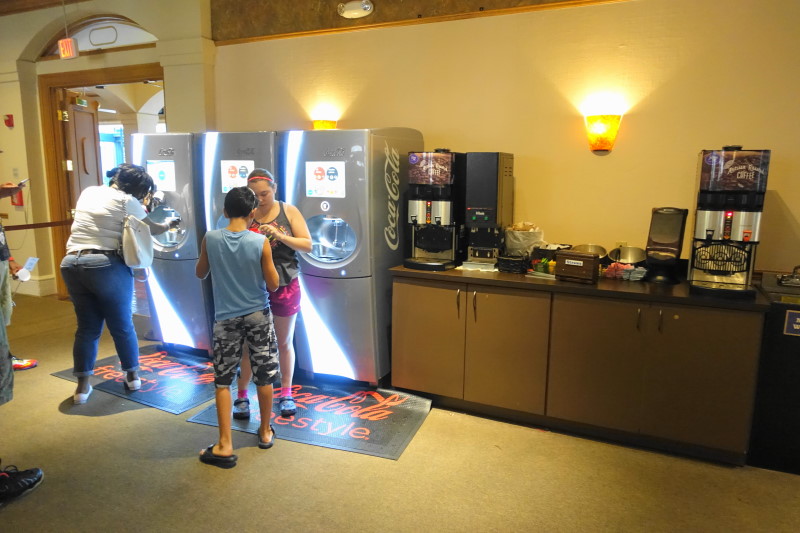
The first option is a small dining set-up in the old table service here, Bonfamille’s Cafe, that closed for cost-savings about a decade ago.
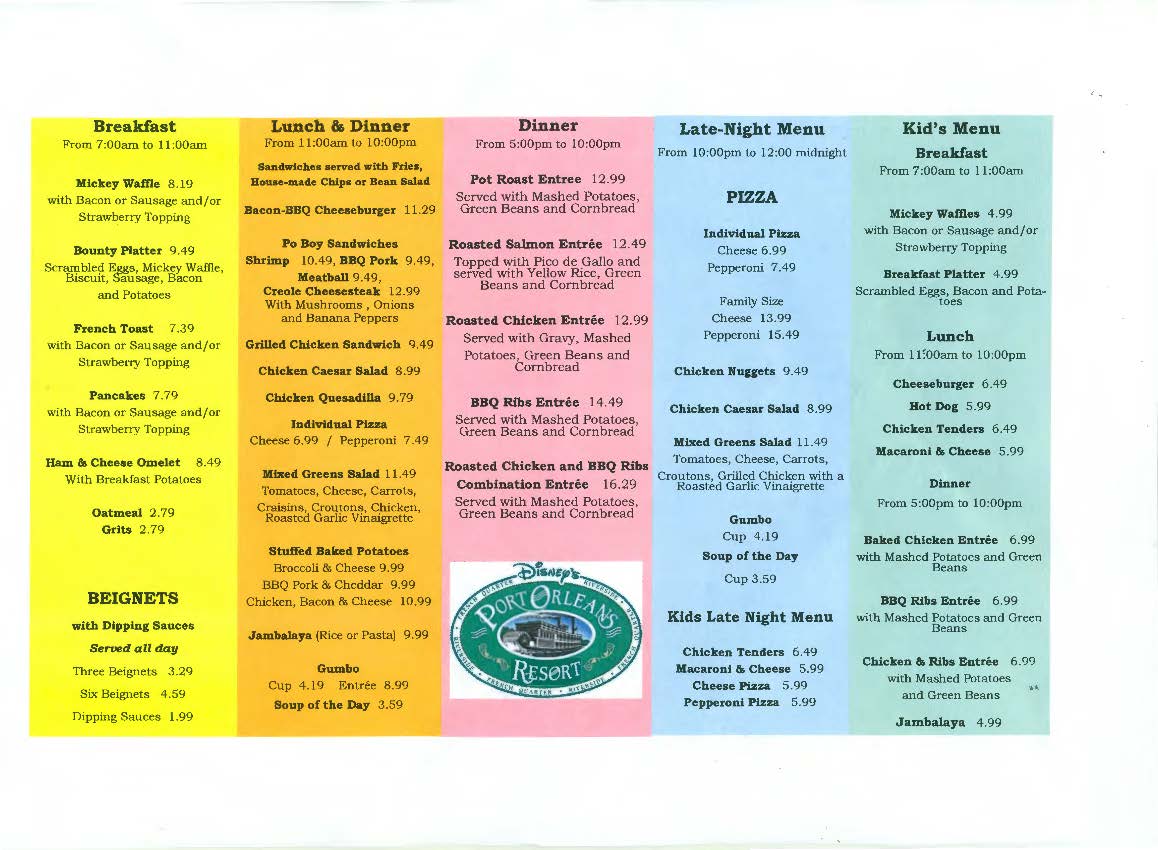
…and the setting.
More photos and menu images are on Andre’s site here.
I did not eat here–I was in the middle of important bus work–so can’t comment on how well it is working.
The second option is to take an internal bus to Port Orleans Riverside and use its dining options.
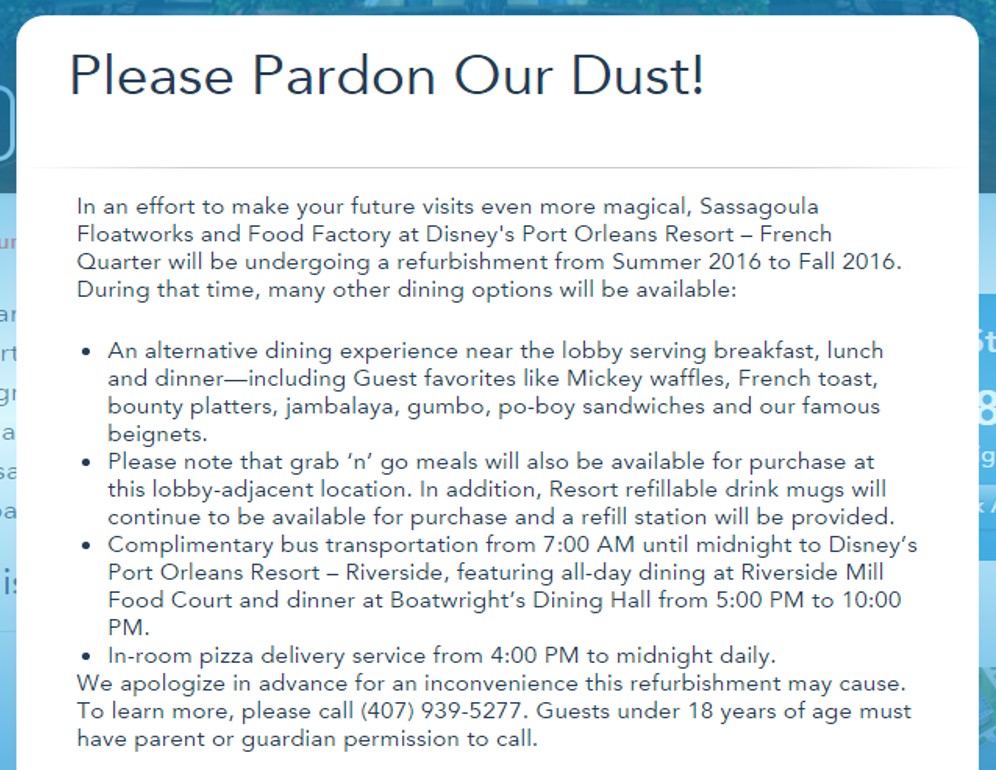
Here’s the word from Disney on the renovation:
The renovation is noted as being through “Fall 2016.” Fall in 2016 ends on December 20…
Follow yourfirstvisit.net on Facebook or Google+ or Twitter or Pinterest!!
September 13, 2016 No Comments
Bus Spotting
A guidebook that I generally quite respect (except for some of its material on the resorts) recently warned visitors off Disney’s Caribbean Beach Resort based on its reader survey results that highlighted “transportation, food court, and distant lobby” as distinct issues.
Your best bet for help in choosing among alternatives is to pay attention to survey results or reviews from people who have recently stayed in all the relevant choices—but of course, other than the reviews in the book I co-author and on this site, you simply can’t find those.
I’ve stayed at the traditional moderates 27 different times, so here’s my take:
- It is certainly true that the check-in building at Caribbean Beach is awkwardly distant, especially for those without a car, but it hasn’t moved recently…so there’s no real need for a new warning based on its location.
- The food court at Caribbean Beach isn’t materially worse than those at the other traditional moderates—and other than the simplification of both the check-out process and the menu at the food court at Coronado Springs (a change this particular guidebook missed, it seems, leaving in a reader comment about the now-disappeared “ticket stamping”), the food courts at the traditional moderates have not changed much recently either. (Port Orleans French Quarter’s food court is currently under refurb—we’ll see if anything interesting comes out of that.)
- And it is true that the sheer number of bus stops (seven) at Caribbean Beach is an annoyance. In terms of time wasted getting around a resort and stopping at all the stops, Caribbean Beach is the worst of the traditional moderates, with Port Orleans Riverside next worst, then Coronado Springs, and Port Orleans French Quarter best. But something that people sometimes miss in the discussion of the number of bus stops is that more bus stops can mean shorter walks within the resort. At Port Orleans Riverside, the longest walk from a room to a bus stop is more than a quarter mile; at Caribbean Beach the longest walk is less than half of that.
Moreover, it’s always possible that better management, or something, results in one resort of the same price class getting materially better bus service than another.
Demonstrating this requires comparative data, not survey opinions.
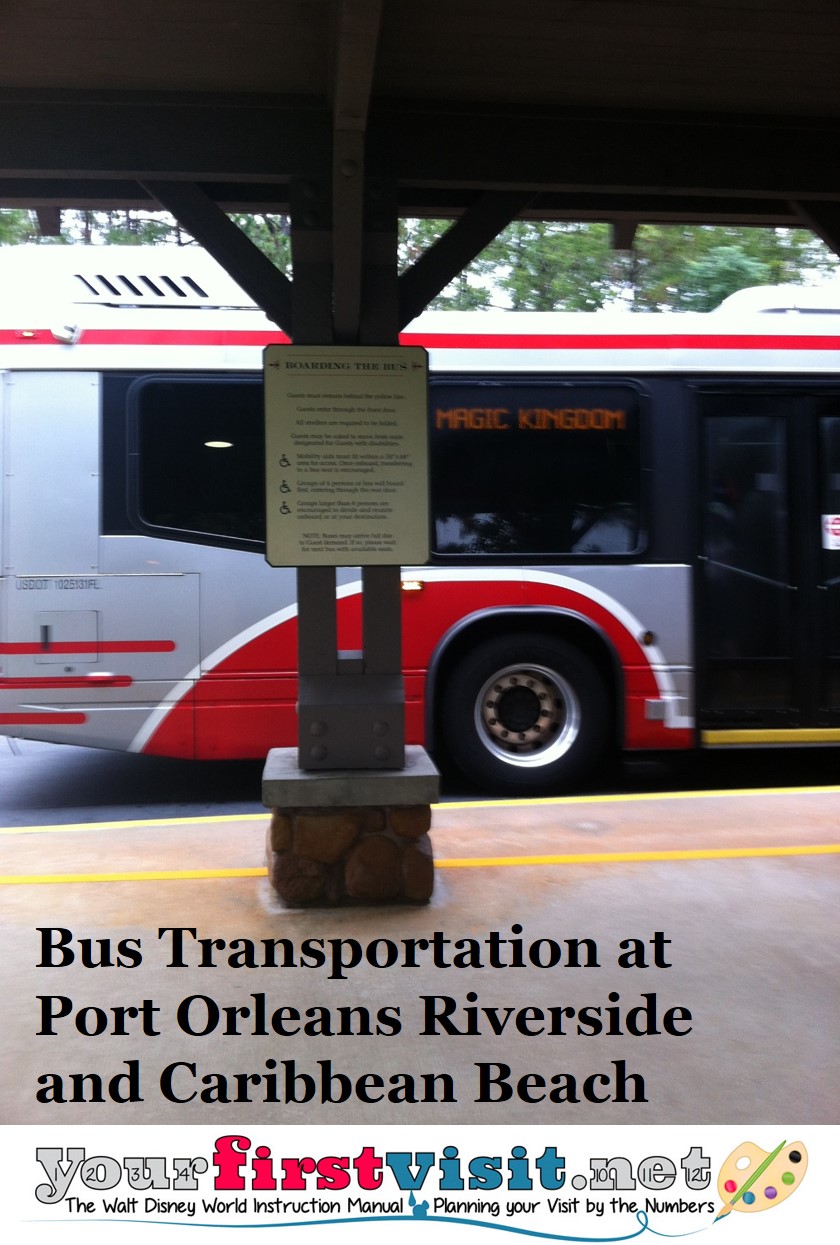
To make an illuminative stab at this because I am such an utter geek to help my readers make good choices, I spent four mornings in late August and early September sitting at bus stops in Port Orleans Riverside and Caribbean Beach timing the arrivals of 139 buses. (Sunday the 28th of August through Tuesday the 30th, and again on September 1; each resort was observed one morning from 8-9.30a and another morning from 8.30-10a.)
I then tossed everything but buses to the four theme parks and then calculated the time between arrivals for buses to the same theme parks. I analyzed the resulting data both in traditional ways (mean and standard deviation) and graphically.
The results of this limited sample show that waits for the next bus were largely similar at the two resorts for most guests, but in every way that they were not similar, Port Orleans Riverside had better service. When you add to this that there are fewer stops at Riverside, transportation on the days I sampled was clearly better at Riverside than at Caribbean Beach.
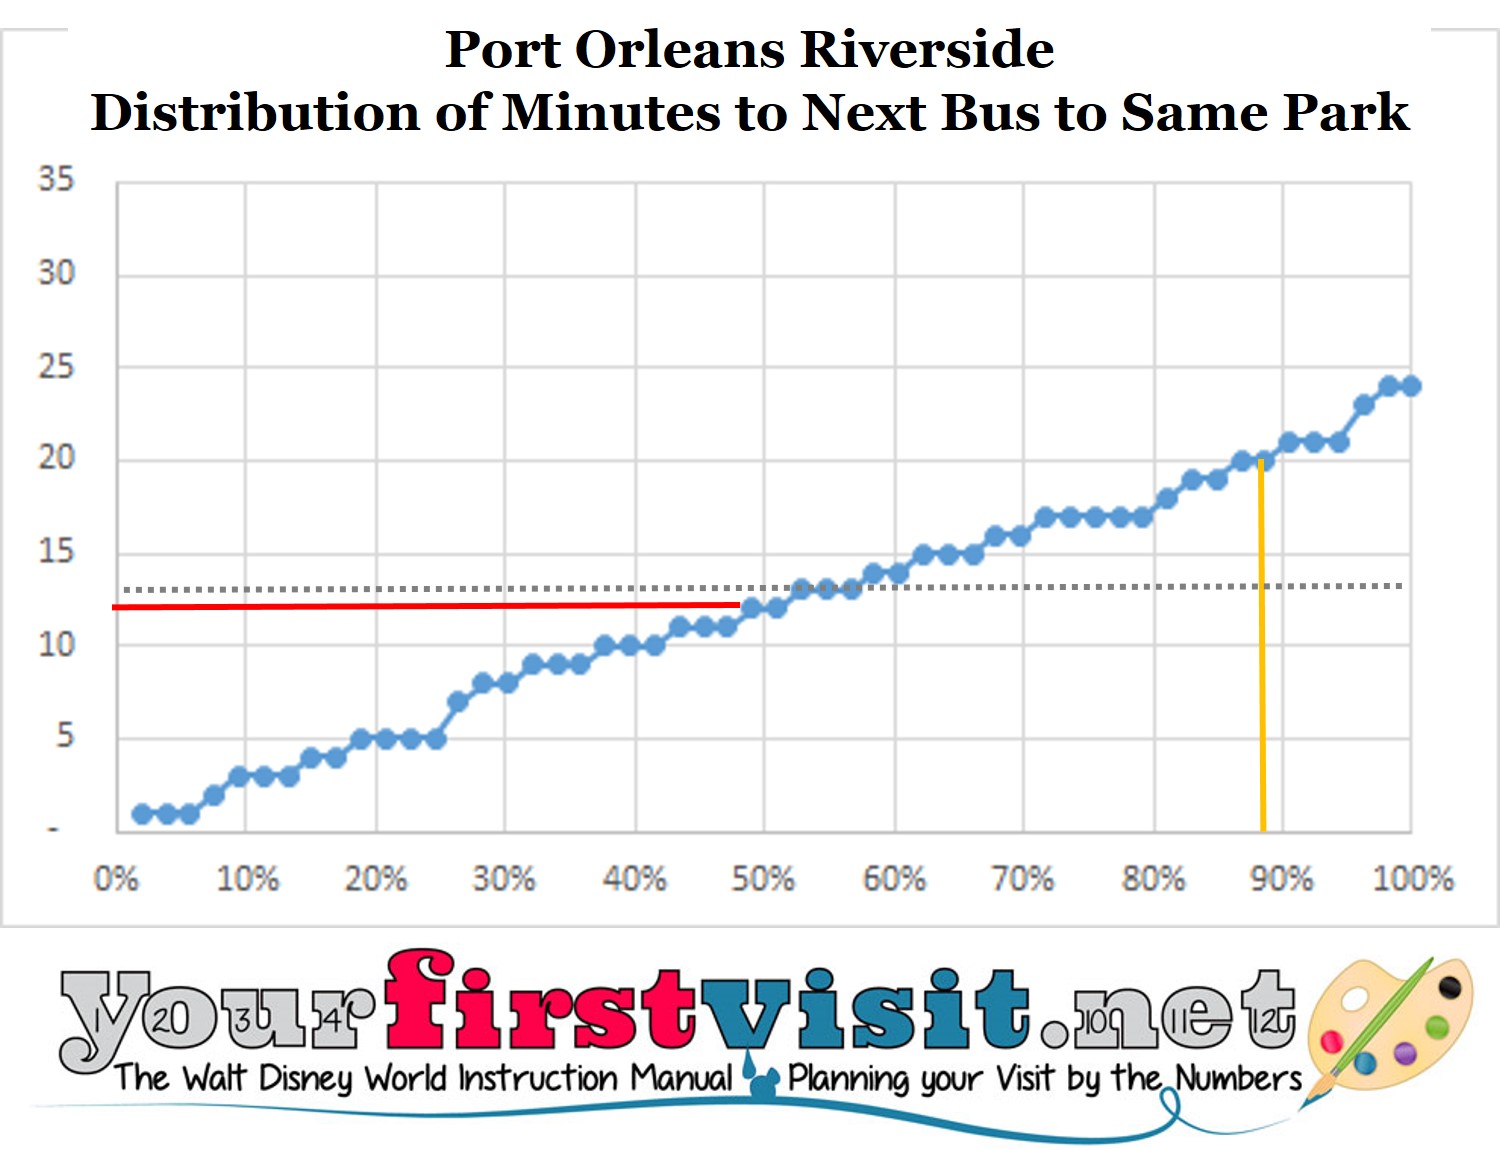
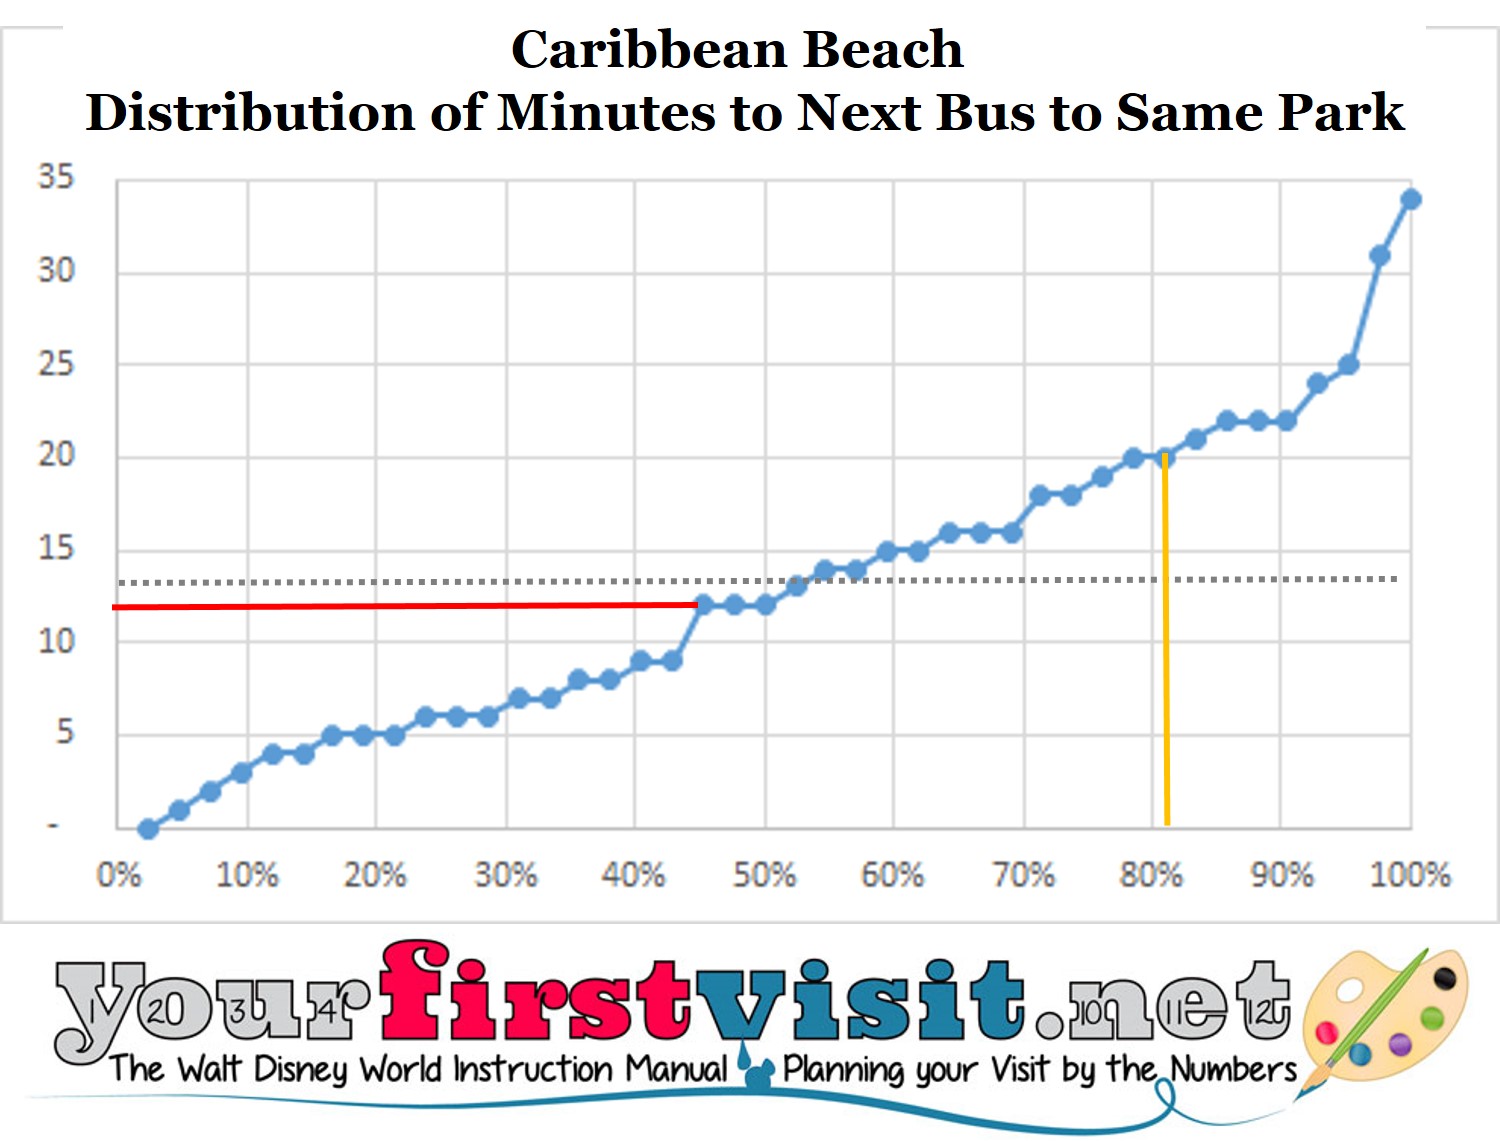
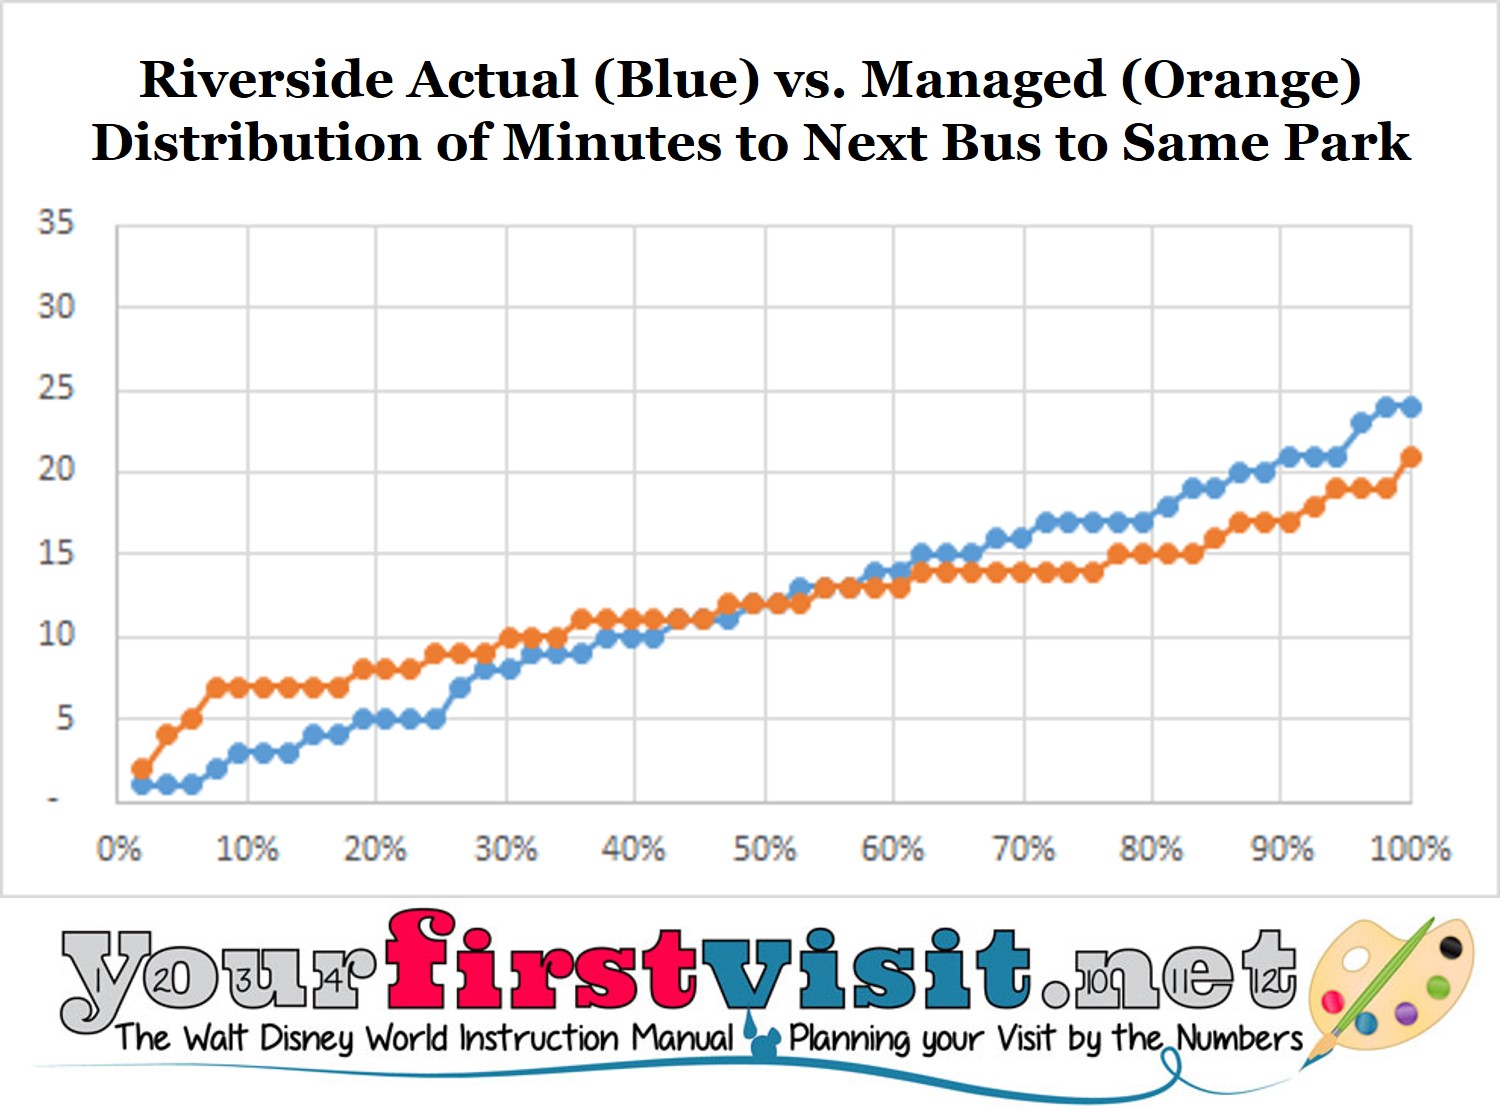
The mean wait between buses to the same theme park at Caribbean Beach was 13 minutes, with a standard deviation of 8.2 minutes. At Riverside, the mean wait was 12 minutes and the standard deviation was 6.6 minutes. As we will see in a minute, the longer mean wait and much larger standard deviation at Caribbean Beach were driven by several excessive waits.
Here’s the graphical depiction of waits at Riverside:
And at Caribbean Beach:
In each graphic the dotted line is the average interval between arrival times for buses to the same park, the red line the 50th percentile wait, and the gold line what percent of buses come in at 20 minutes or fewer.
You’ll note that the biggest difference was in the longer waits–at Riverside, almost 90% of arrivals were 20 minutes or fewer, and the longest interval was 25 minutes. Caribbean Beach saw almost twice as many buses with >20 minute waits, and its longest wait was a stinky 34 minutes.
Something I did not adjust for in my analysis was the effect of buses to the same park that came one right after another.
For example, during one period at Port Orleans Riverside, Magic Kingdom buses came by at 9.18, 9.22, 9.23, 9.44 and 9.45a, for intervals of 4 minutes, 1 minute, 21 minutes, and 1 minute. The average wait time among these four intervals was 6.75 minutes.
But practically speaking a bus that comes one minute after another bus to the same park is of next to no value, as the arrival rate of people at the bus stops means that no or next to no incremental guests will be served by the bus arriving a minute later. Treating the two one minute waits as though they did not help any incremental people, we get 12.5 minutes as the average wait—almost twice as long.
Note in the graphics how many buses came by with a five minute wait or less (20% of them at Caribbean Beach, and 25% at Riverside). Guests would be better served if these buses were re-routed before their first stop to whatever park was fourth on the list of most recent buses…
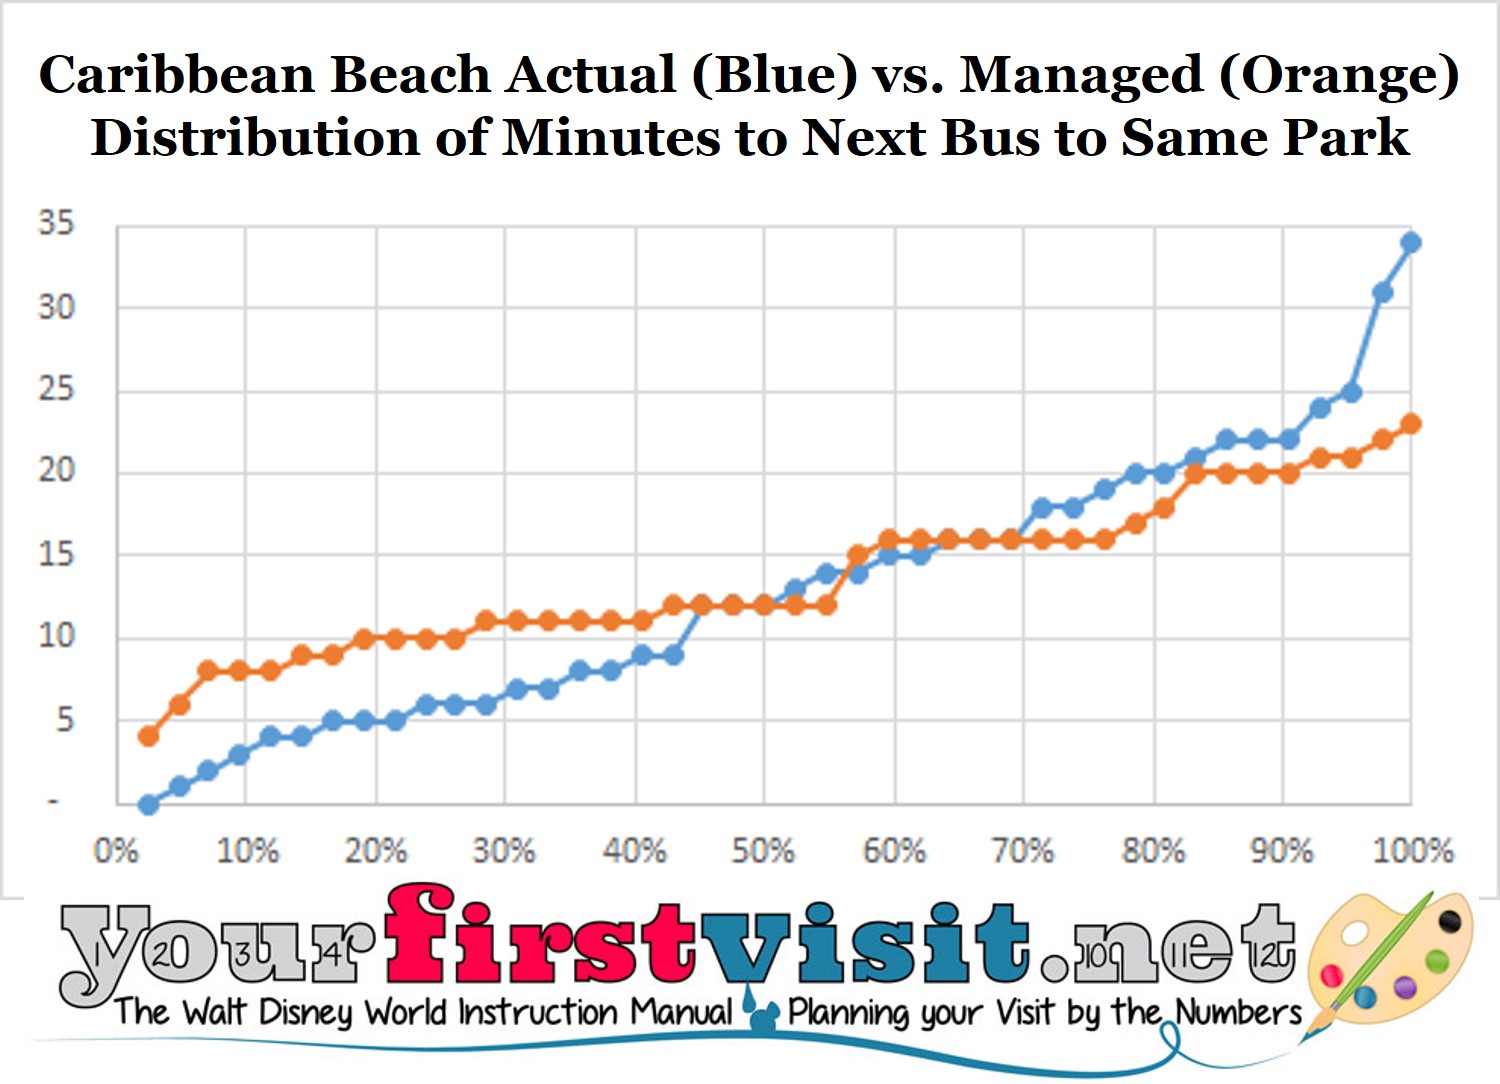
To illuminate the impact of this, I redid the waits showing the exact same arrival times, but a steady progression of buses to the four parks so that none was repeated before all four had been served.
Here’s the results:
The effect was to add wait time to the left sides of the curves and remove it from the right sides–essentially moving time from artificial short waits from the left side (artificial because few or none would benefit from them) to reducing waits on the right side where they actually created value for people. (t statistic = “Mister.”)
How about it, Disney?
The traditional moderates are the hardest to distinguish among for recommendations. Each is at the top of some important criteria and at the bottom of others.
This means that either you should not sweat the difference among them, or that you should deeply research them to find which is exactly the best fit for your family.
But one thing that has always been true is that the total Disney transportation experience is worst at Caribbean Beach. If that’s your single concern, then that guidebook is right, and you should avoid Caribbean Beach.
You’ll find a more nuanced discussion of the moderates in my guidebook, and if you want to deeply research them, my reviews of each begin at the following links:
Follow yourfirstvisit.net on Facebook or Google+ or Twitter or Pinterest!!
September 12, 2016 11 Comments
Fort Wilderness: Loop 2100 and New Fences
A couple of updates from a drop-in at Disney’s Fort Wilderness Resort & Campground at the end of August.
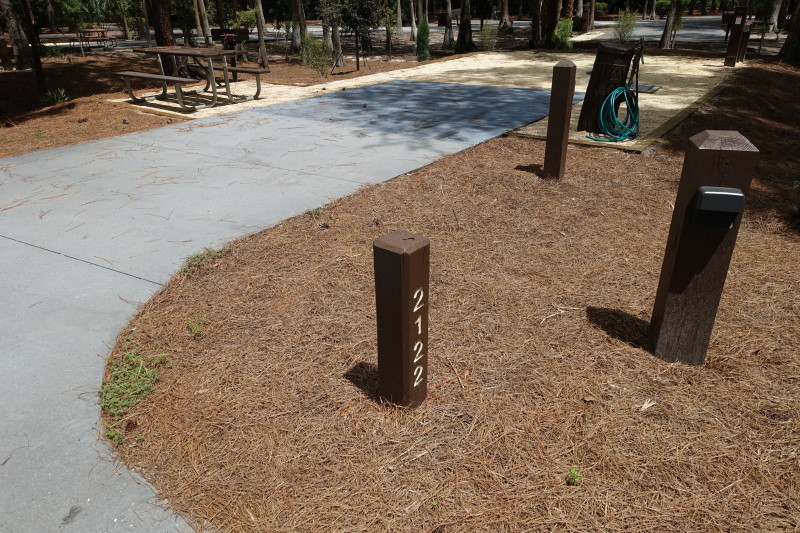
LOOP 2100
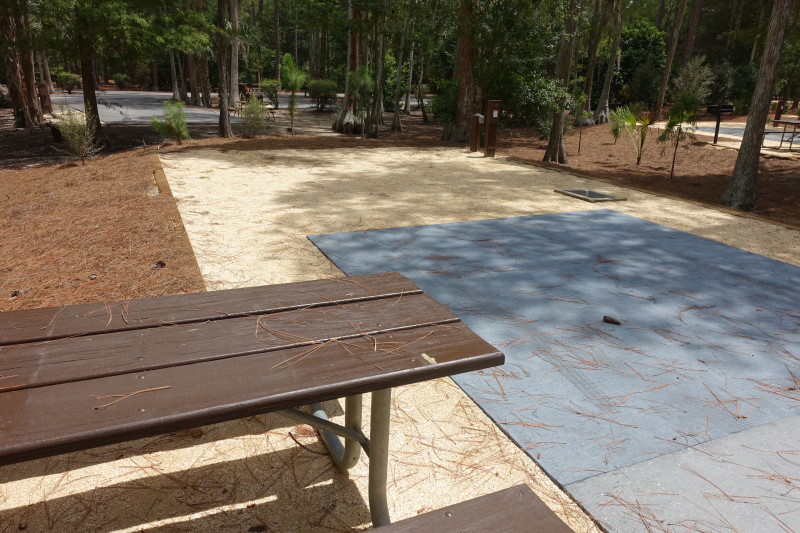
The Cabins were removed from Loop 2100 earlier this year, and after what for Disney was an incredibly quick re-do, a new set of camping sites has now opened there.
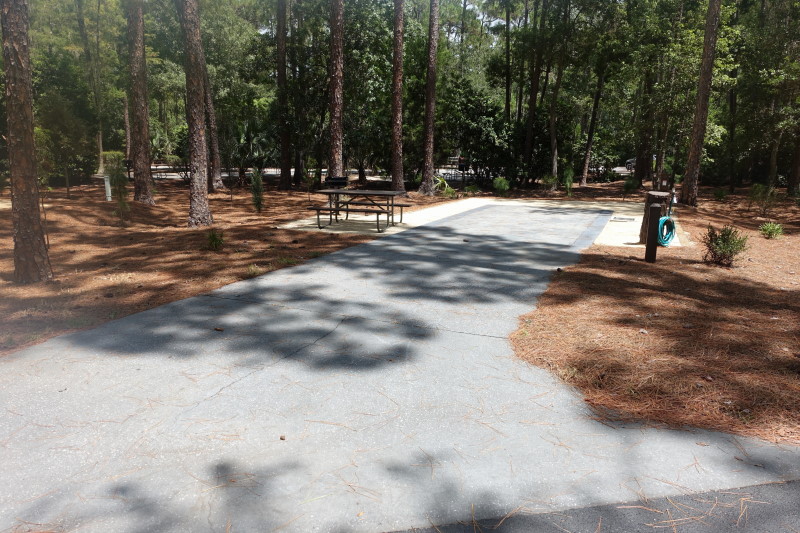
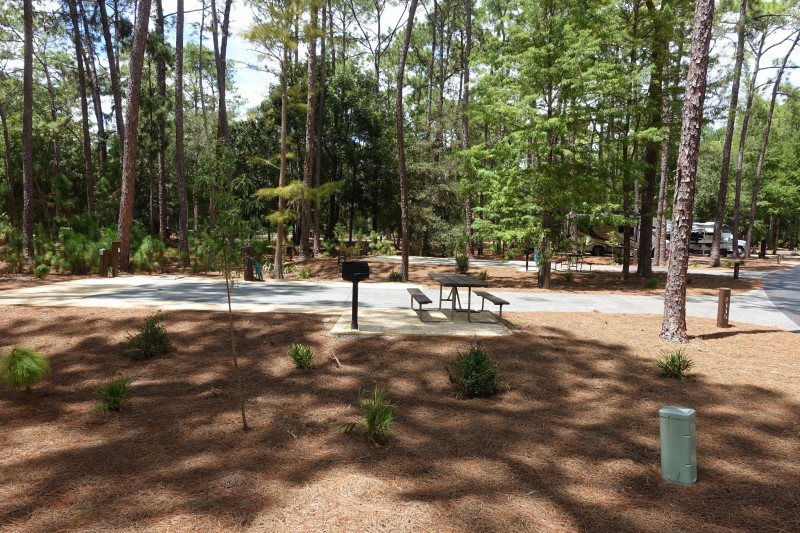
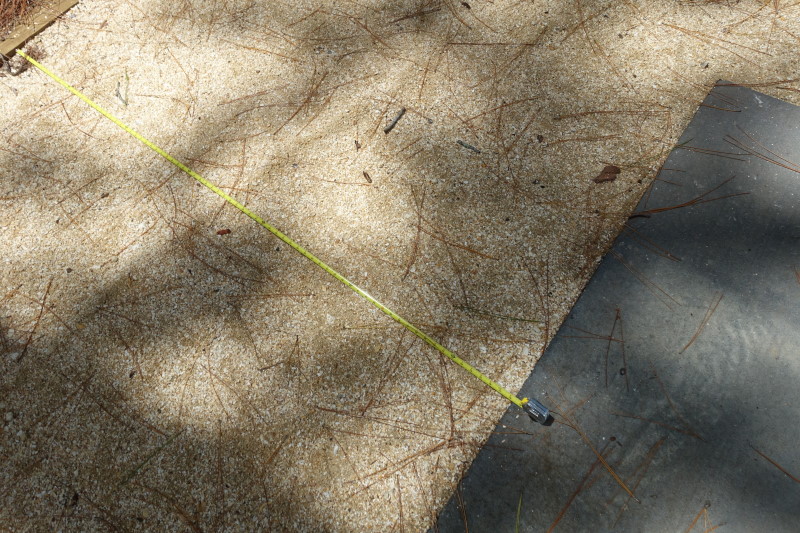
The new sites typically have a 12 foot wide driveway…
…an offset sand pad with the picnic table and grill…
…and a six foot sand pad at the back.
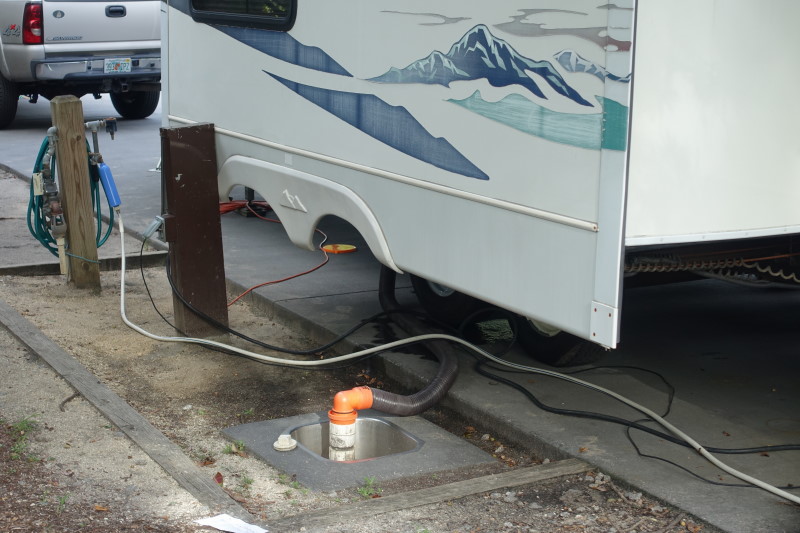
These typical sites are a little curious. The asphalt is not wide enough or (mostly) long enough to serve as premium sites, or even fit some slide-outs.*
But the six foot sand pad at the back is too small for all but the smallest of tents, making these not typical of “full hook up” sites.
Then in the middle of them oddly is this site…
…with a 20 foot tent pad at the back. This was the only site like this I saw at Loop 2100.
Perhaps this is an “overflow site,” aimed at all different kinds of gear, but mostly at those without tents.
Note that there’s more photos of and discussions about this loop on the FortFiends.net forum–e.g. here.
*The photo is not from 2100, but I could not resist it…
WATER FENCES AT FORT WILDERNESS
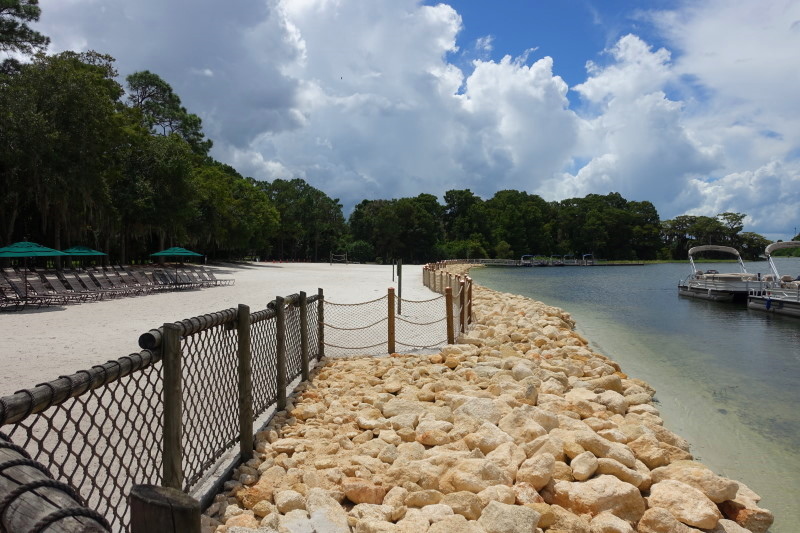
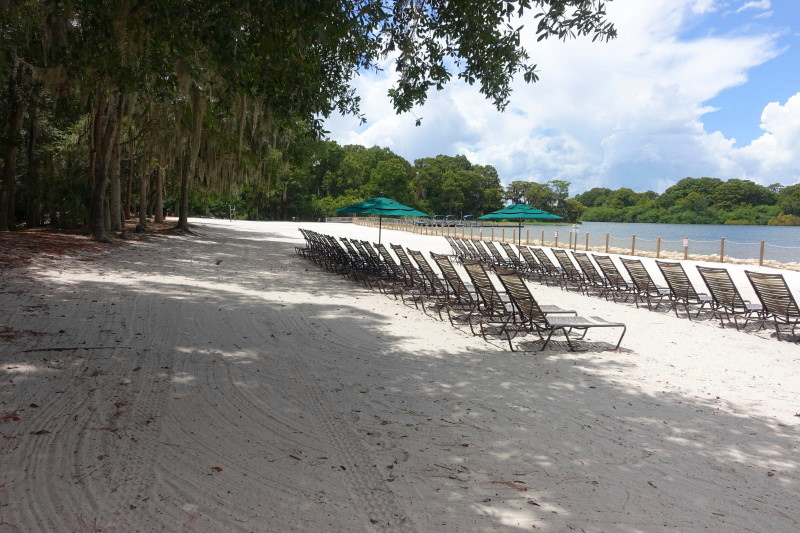
The beach area at Fort Wilderness, like those in the rest of the Disney-owned resorts, is now fenced at the water:
Another view:
I found myself getting used to these fences quite quickly (on this trip I photographed them at every resort), and not finding them wildly obtrusive.
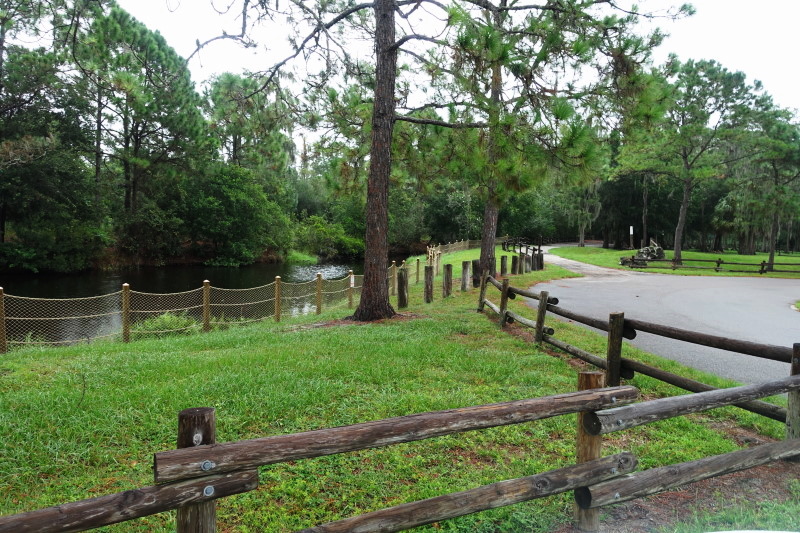
But I did wonder if the internal waterways at the Fort would get fencing as well.
The short answer is mostly not.
The only other fencing I found was near the group campsites at Creekside Meadows–probably a wise move if the groups camping here are like my scout troop.
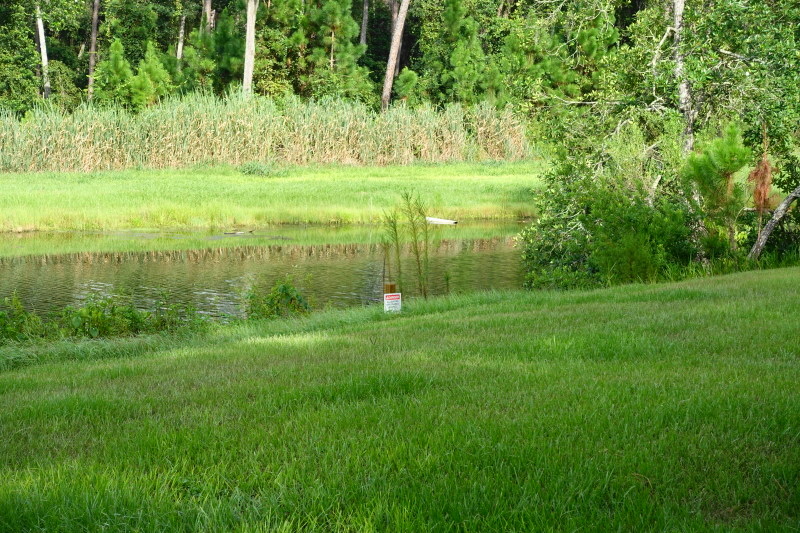
Otherwise, all I saw were warning signs:
I was glad to see that these waterways are not fenced…
Follow yourfirstvisit.net on Facebook or Google+ or Twitter or Pinterest!!
September 11, 2016 2 Comments
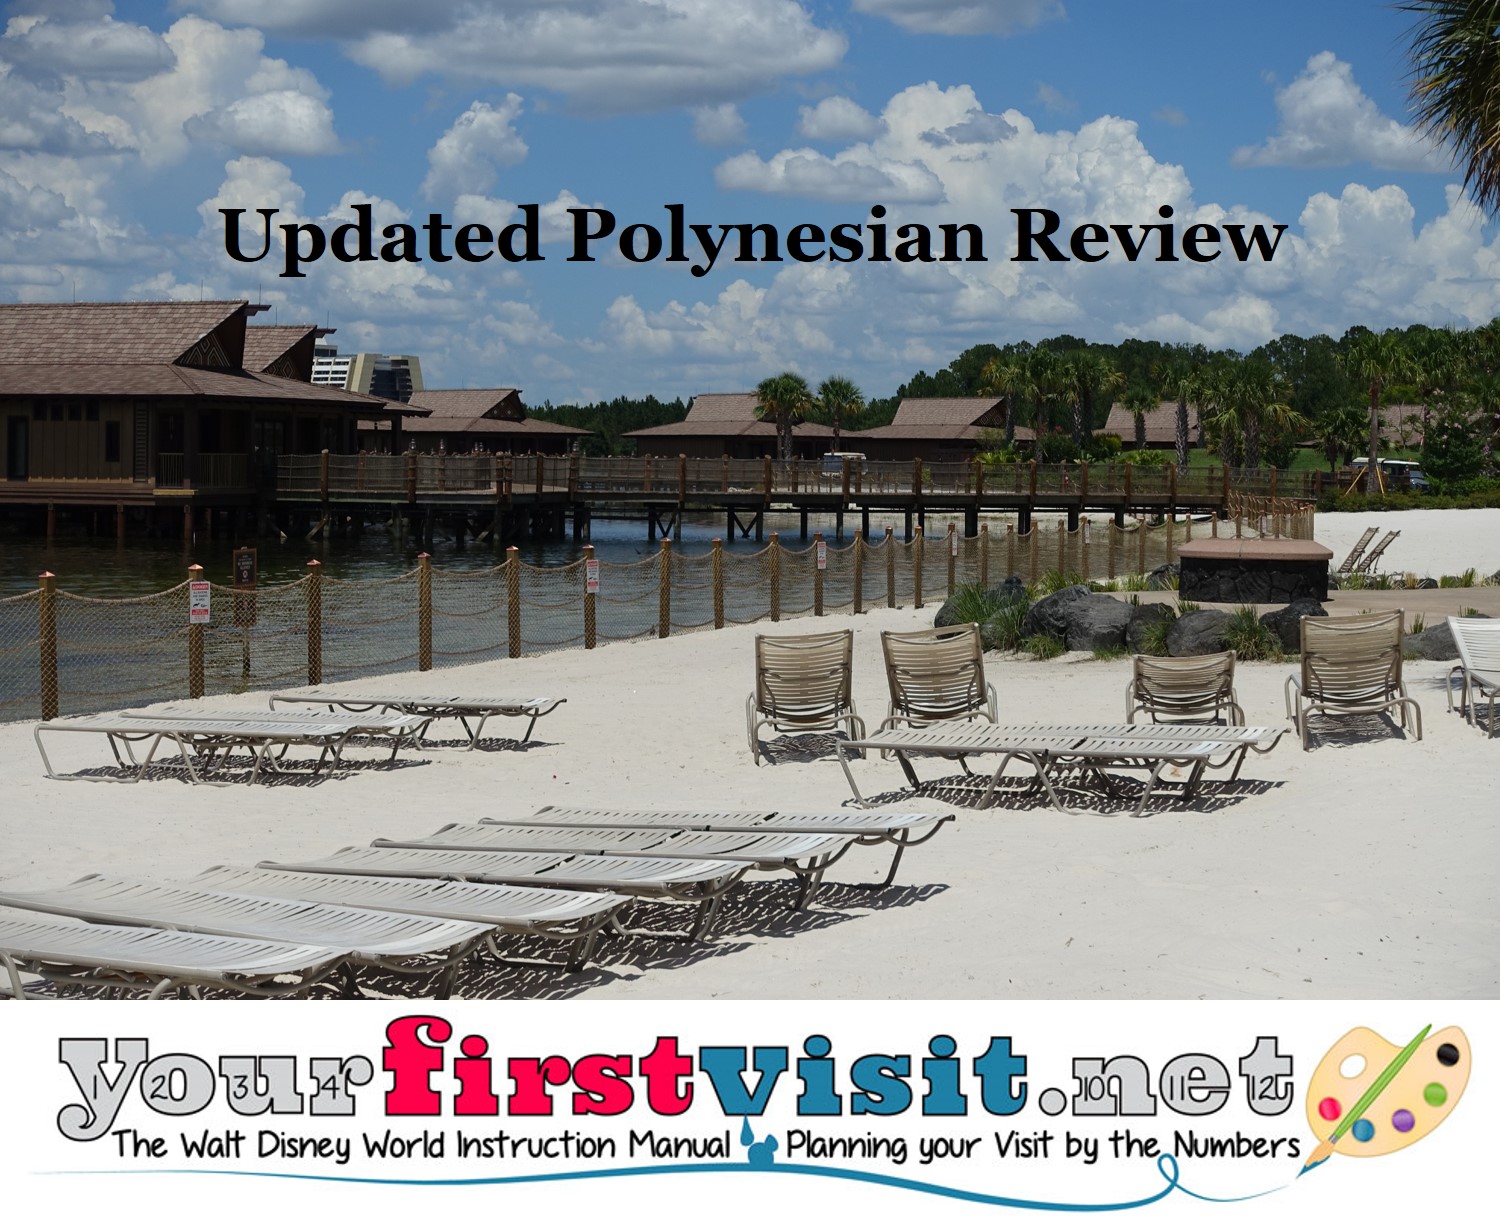
Updated Review of Disney’s Polynesian Village Resort
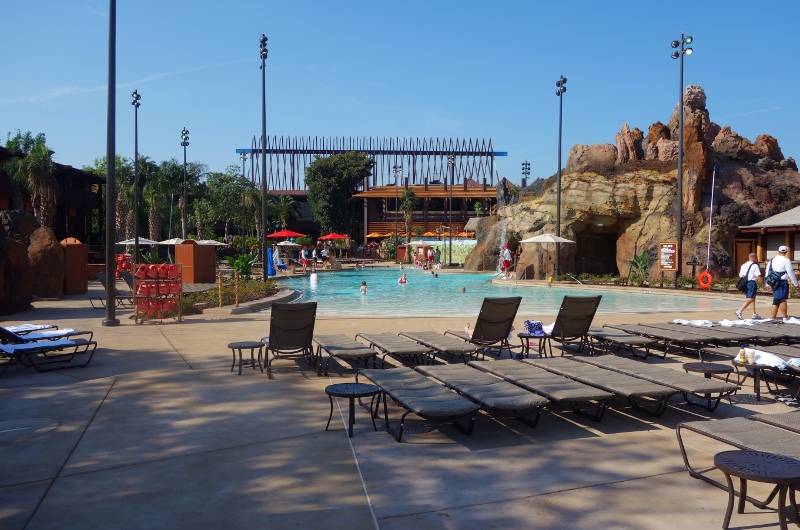
This morning I published my updated review of Disney’s Polynesian Village Resort, based on my stay—my sixth here—in mid-July.
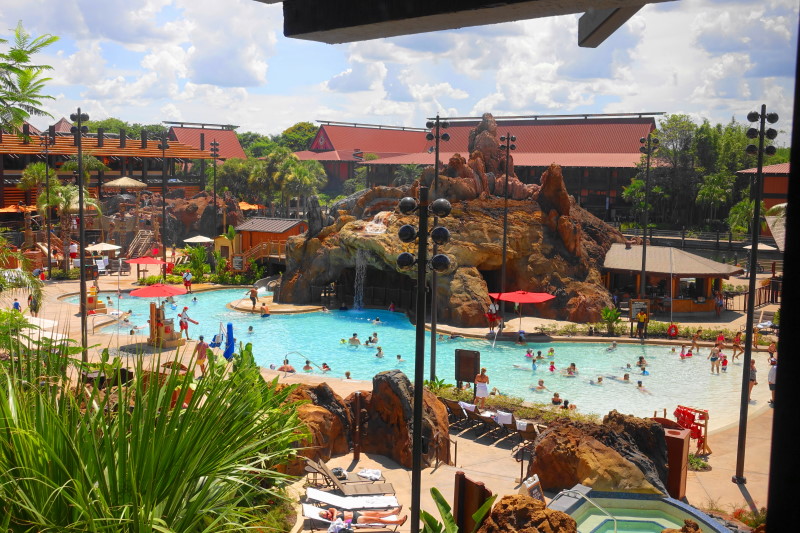
The updated review begins here, and includes all-new room pictures, better pictures of the new Oasis Pool, a new photo tour of a Bungalow, updated restaurant reviews from The easy Guide’s 2017 edition, and more.
I also re-ordered the flow of material as I have been lately with my updated reviews, so that the overview of accommodations now comes before the photo tour of a standard room. Which makes sense, I think!!
Here’s the topics covered in the review, in their new order:
- Summary and Overview of Disney’s Polynesian Village Resort
- Accommodations at Disney’s Polynesian Village Resort
- Photo Tour of a Standard Room at Disney’s Polynesian Village Resort
- Amenities at Disney’s Polynesian Village Resort
- Dining at Disney’s Polynesian Village Resort
- The Pools at Disney’s Polynesian Village Resort
- The Disney Vacation Club at Disney’s Polynesian Village Resort
- Photo Tour of a Studio at Disney’s Polynesian Village Resort
- Photo Tour of a Bungalow at Disney’s Polynesian Village Resort
This visit was my first in a Club room at the Poly, and also my first in a Magic Kingdom view room there. While you’ll see photos related to both in the updated review, I didn’t not write in much detail about either.
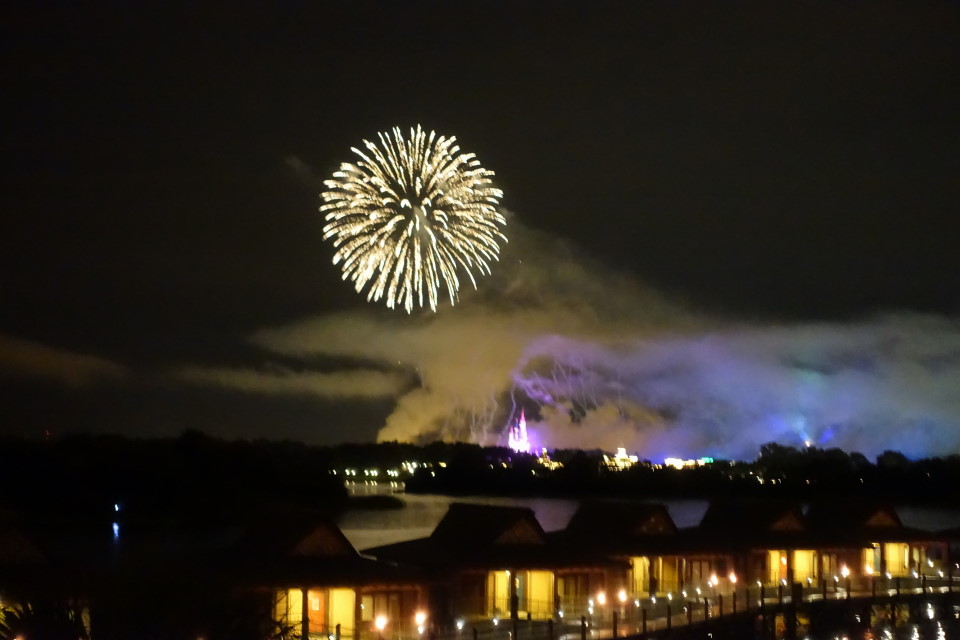
Rather, I’ll be doing a separate post on club rooms later (it’ll be similar to Tom Bricker’s post, based on my room, here), and will do a post on theme park view rooms (an image shot from my balcony is above) in September, after my stay in a Grand Floridian theme park view room on my next visit.
Follow yourfirstvisit.net on Facebook or Google+ or Twitter or Pinterest!!
August 17, 2016 2 Comments
Photo Tour of a Bungalow at Disney’s Polynesian Village Resort
(For the first page of this review of Disney’s Polynesian Resort, click here.)
The Bungalows at the Polynesian Village are part of the Disney Vacation Club offerings at the Poly, but are also open to non-DVC members to book either via rented points, or for cash like any other Disney World room.
A lot of points, or a lot of cash. In 2020, they are $3,000-$5,250 a night…
Needless, perhaps, to say at those prices, the photo tour below is the only one on this site that’s not of a room that I paid for and stayed in. Rather, in a recent stay at the Polynesian, I was offered a tour of a Bungalow, and the photos are from that tour.
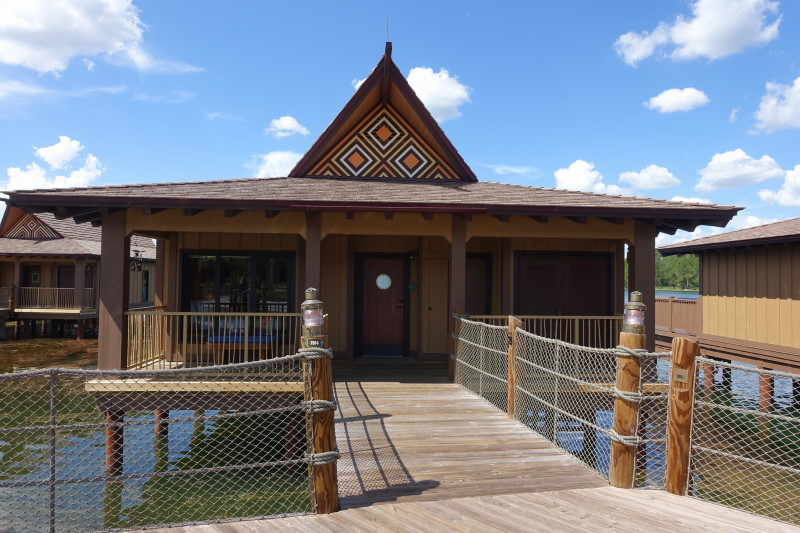
The Bungalows are stand-alone buildings built on pilings in the Seven Seas Lagoon just offshore of the Polynesian beaches.
The entry is from a common boardwalk.
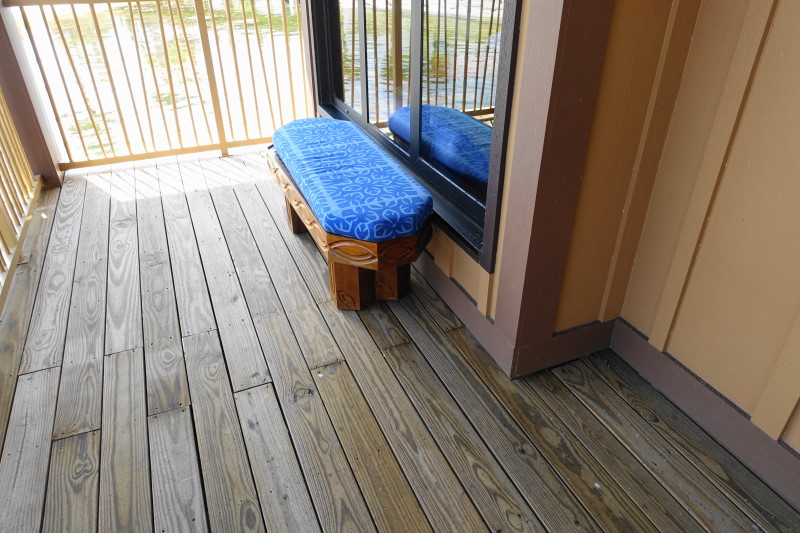
The entry deck includes a bench.
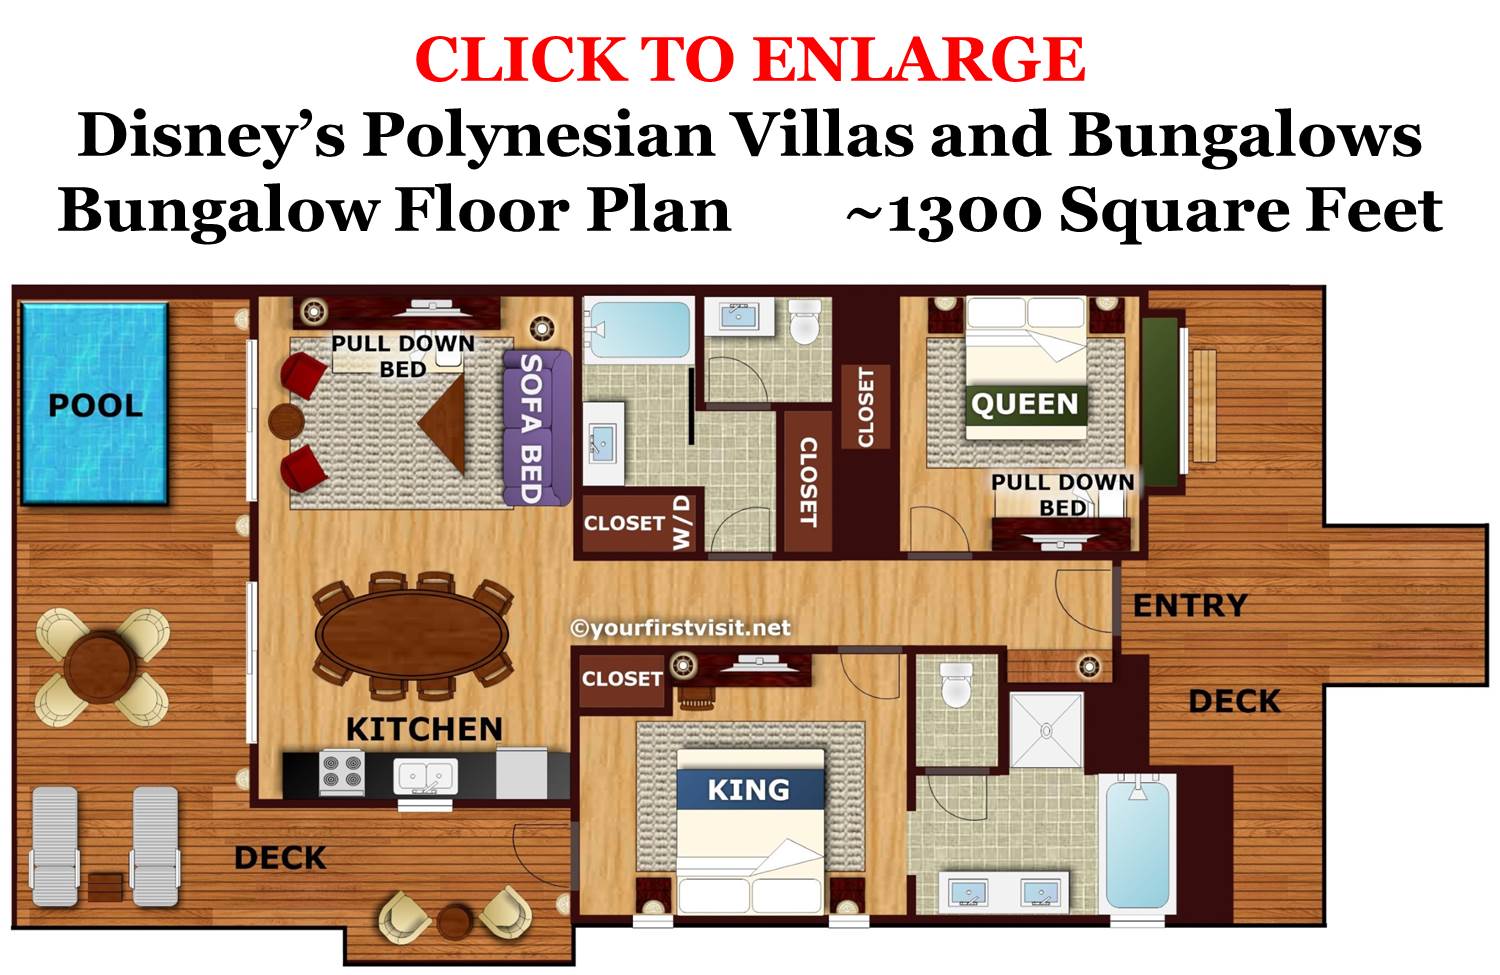
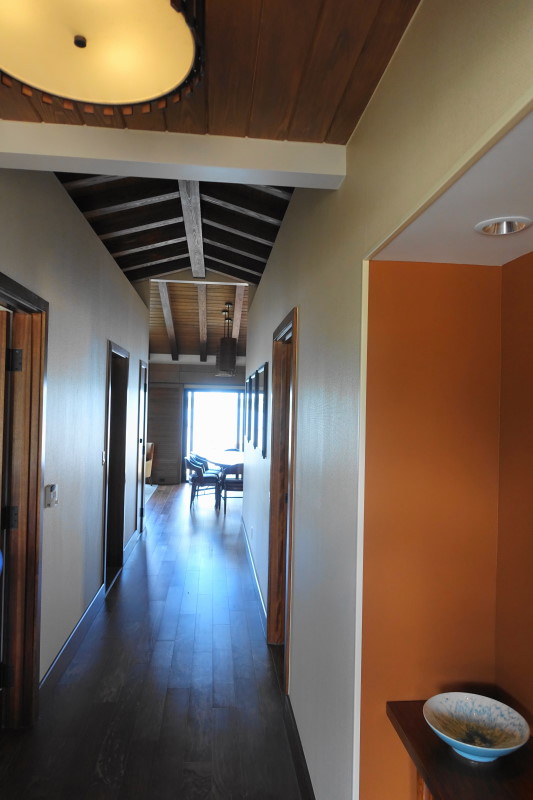
You enter into a narrow hallway, with bedrooms and baths on either side. This reserves the views towards the Magic Kingdom for the common living areas at the other end–although the master bedroom does have a windowed door aimed at Magic Kingdom as well.
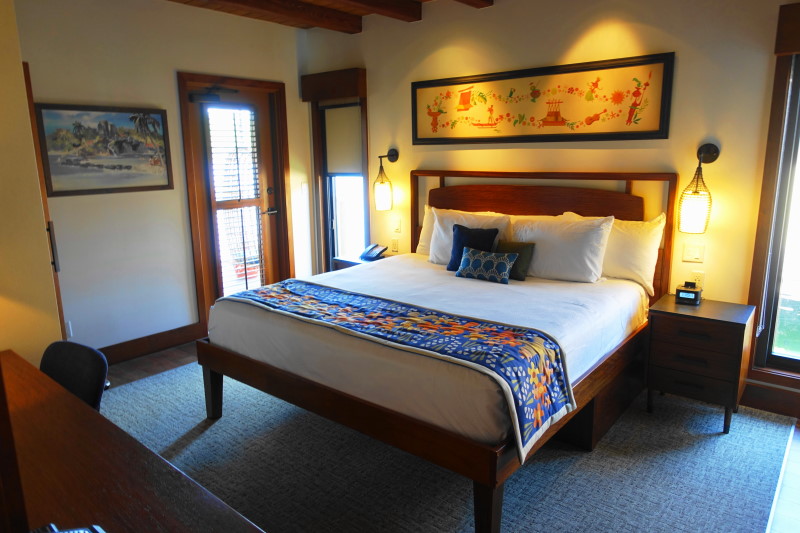
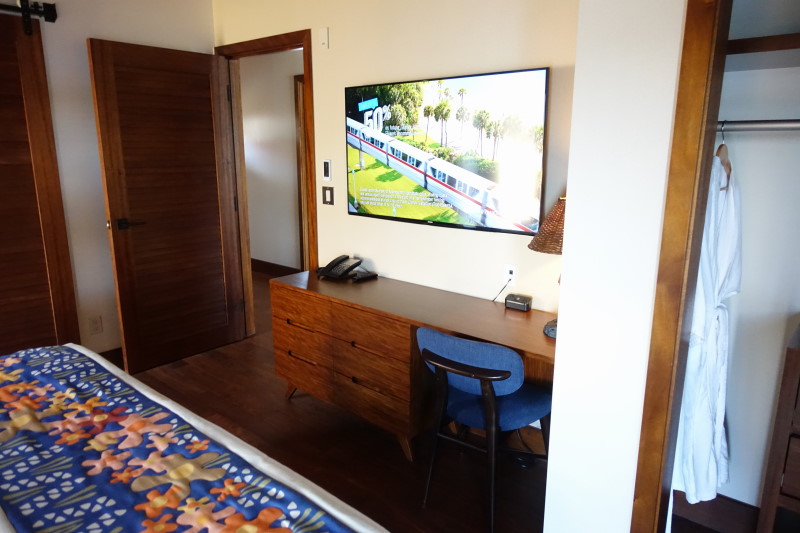
One side has the master bedroom, with a king bed…
…desk, dresser, and closet…
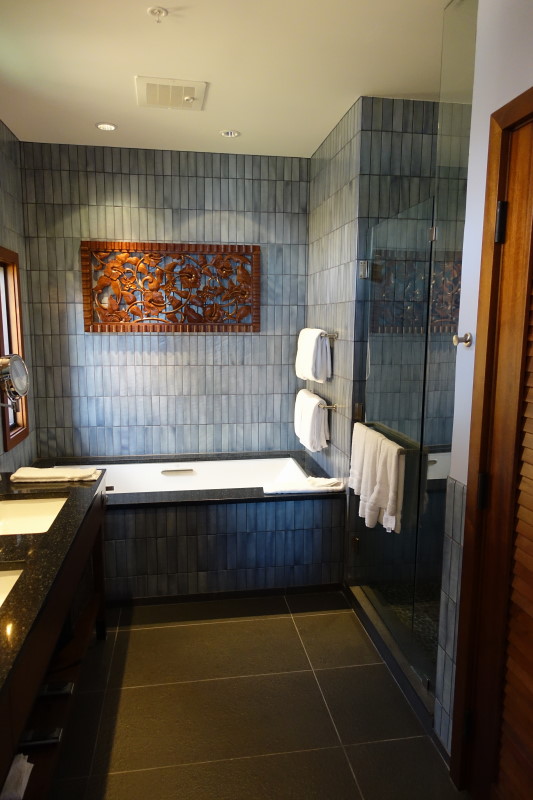
…and a large private full bath with separate tub and shower.
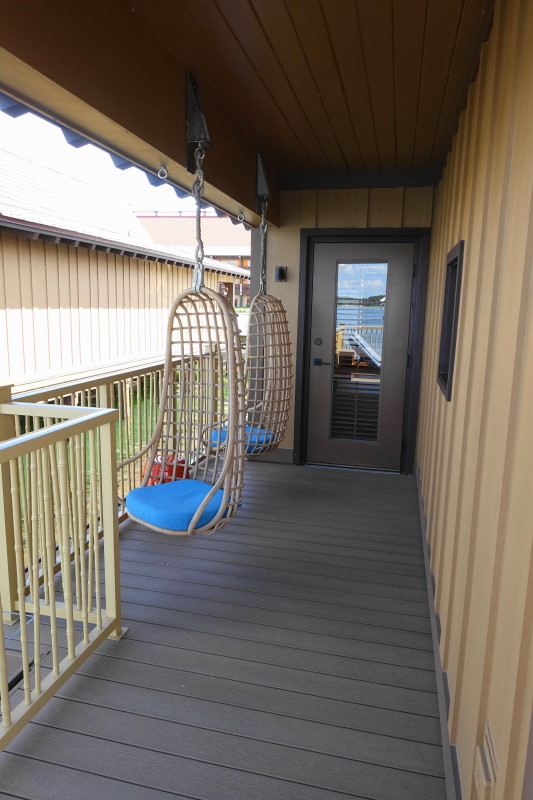
A fully-windowed door from this space leads to the back deck and a couple of charming hanging deck chairs, facing the Magic Kingdom. This view is from the deck towards the door.
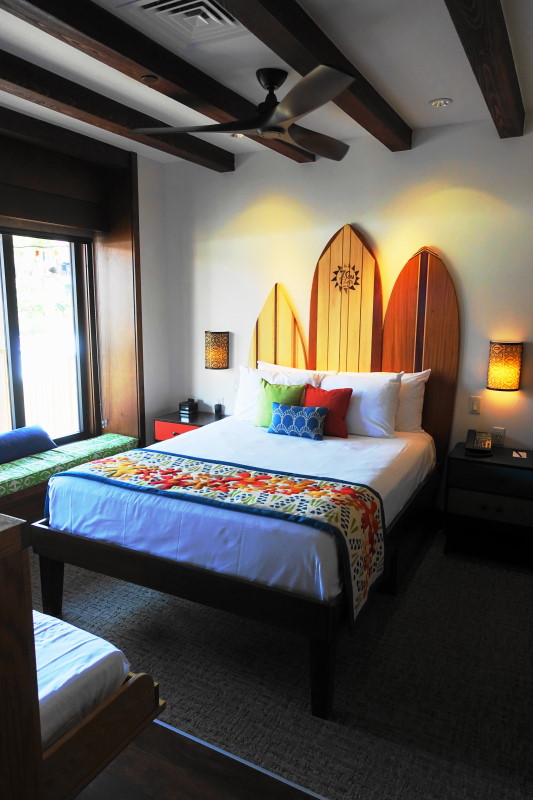
Across the hall is the smaller queen bedroom. Note the window seat on the left of the image.
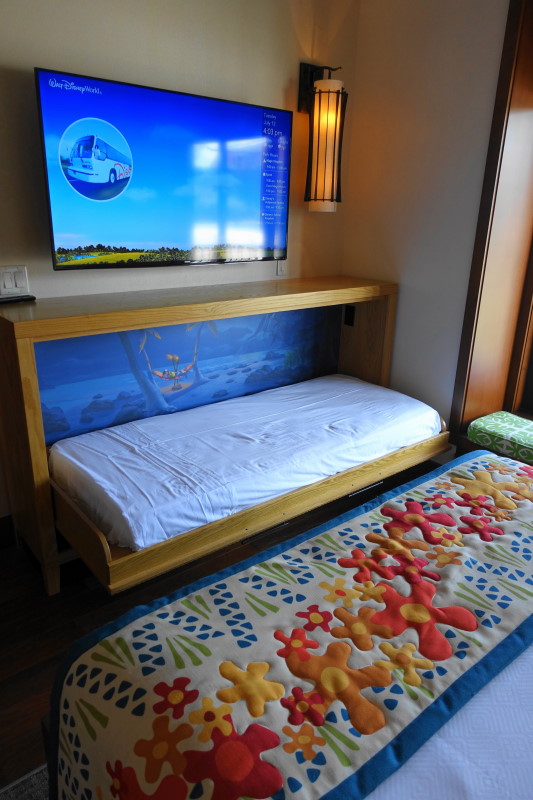
This bedroom also has a fold down bed that measures around 6′ by 30″.
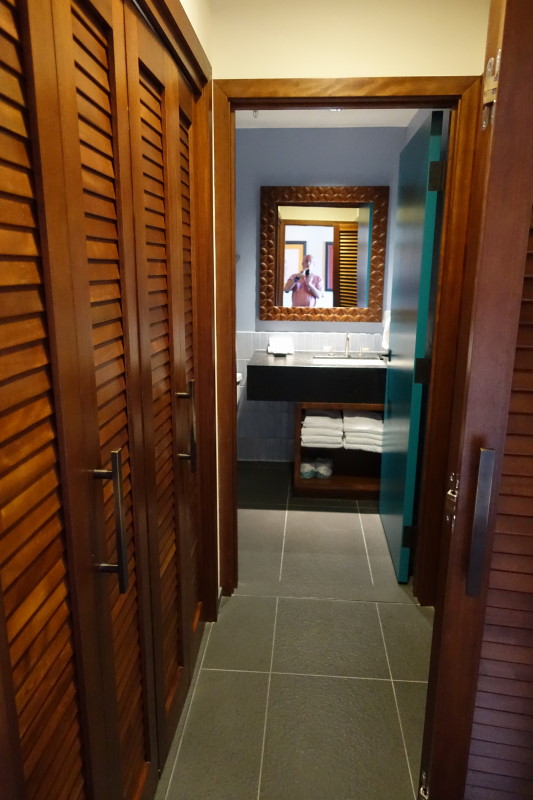
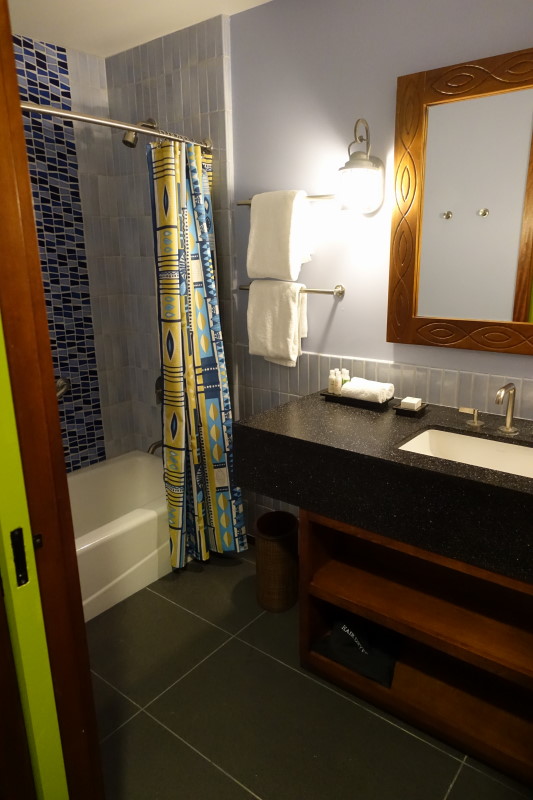
A bath for the folks sleeping here and for the three people the living room will sleep is also on this side, accessed from the main hall.
A closer view of this bath…
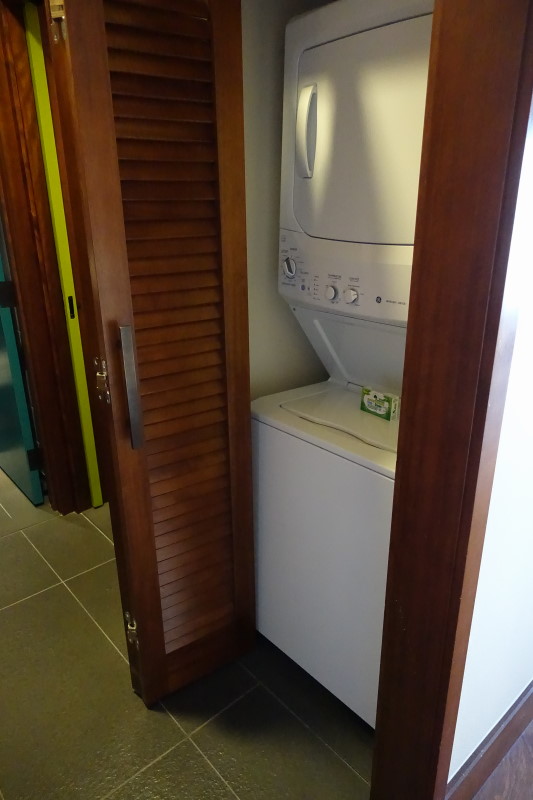
…and of the nearby washer/dryer combo.
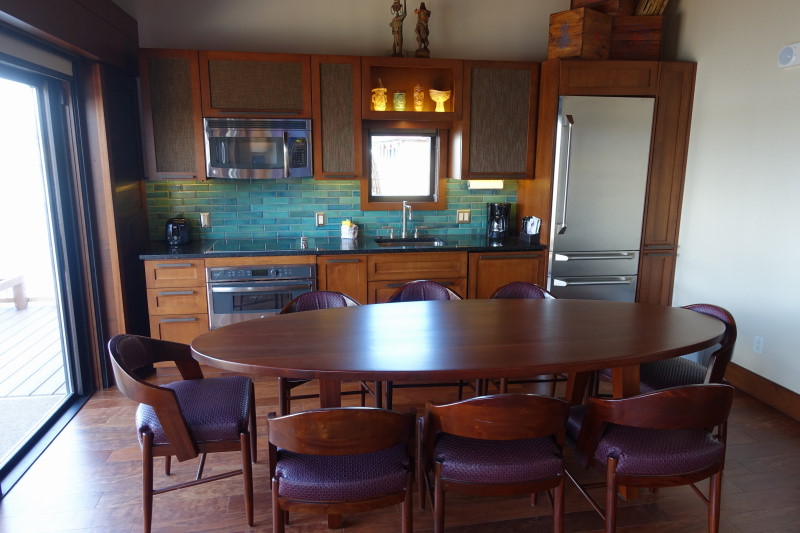
The end of the interior is a great room with a kitchen and dining table on one side…
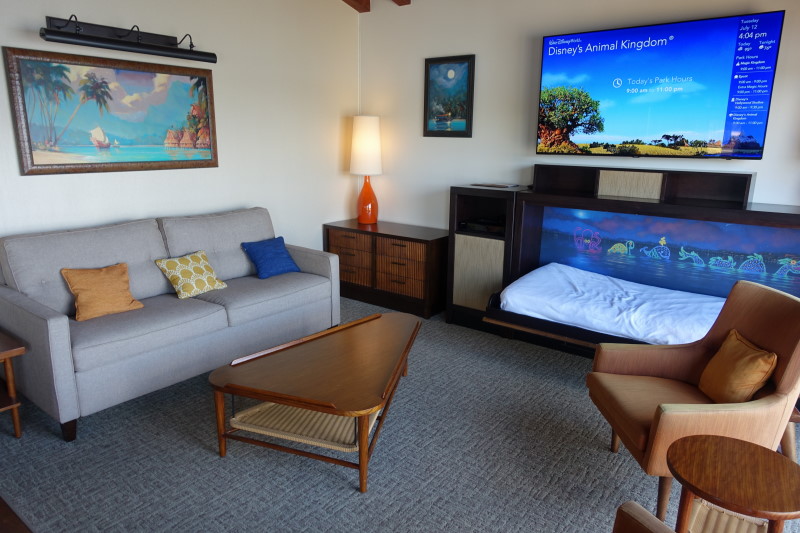
…and a living room that’ll seat 5–with more chairs available from the dining table–on the other.
You can see a fold down bed of the same proportions as that in the queen bedroom. The couch also folds out to sleep two more.
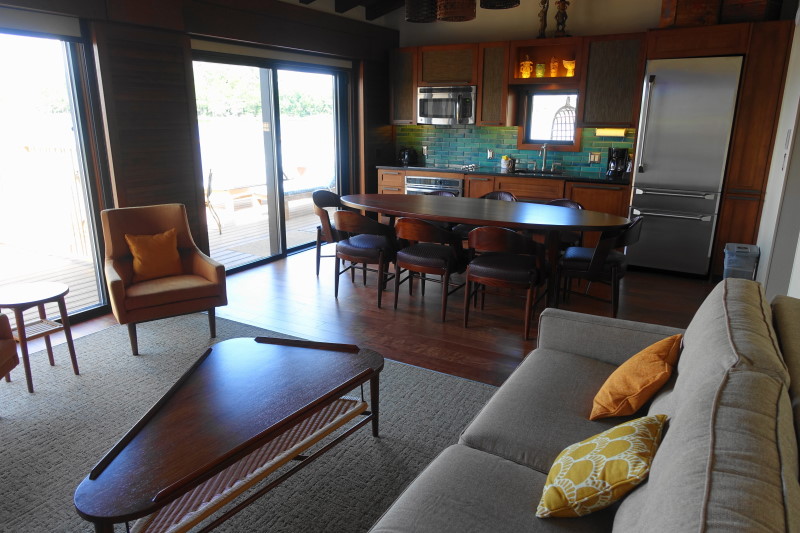
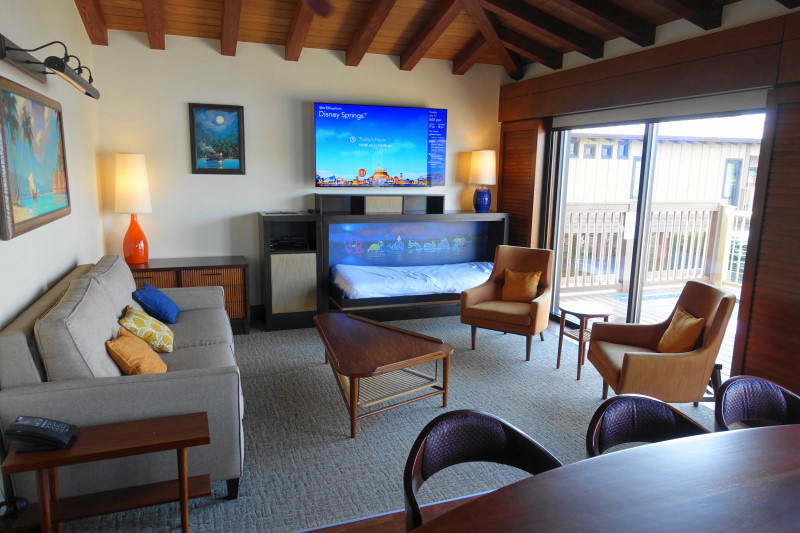
More shots of the dining/living area:
Outside is another deck, this one on the Magic Kingdom side of the Bungalow.
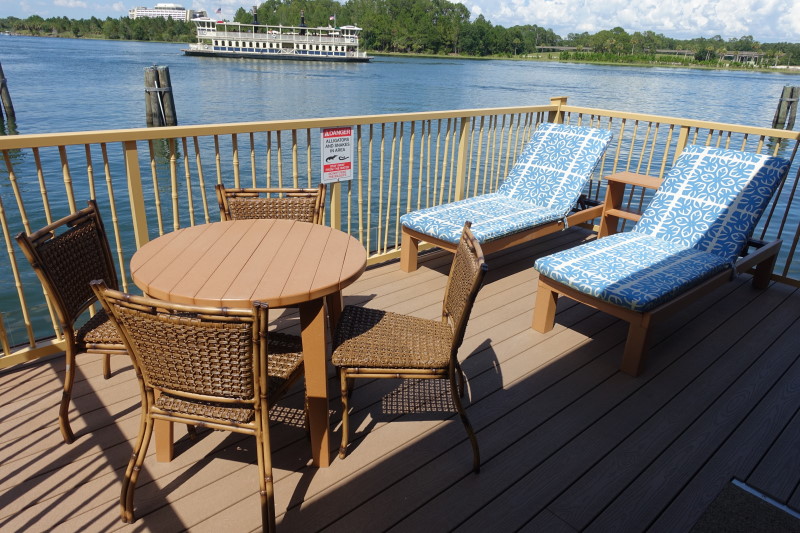
It includes lounge chairs and a table for four…
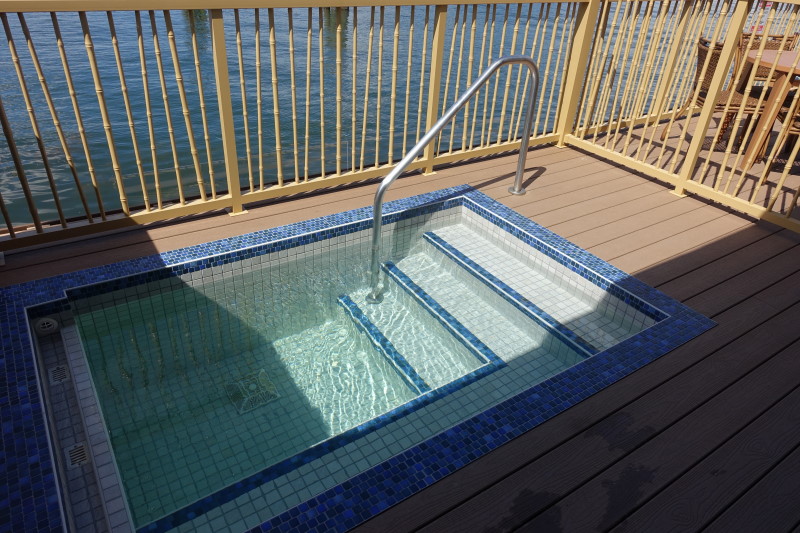
…and also this unheated small pool, big enough for a couple of adults to cool off, or several kids.
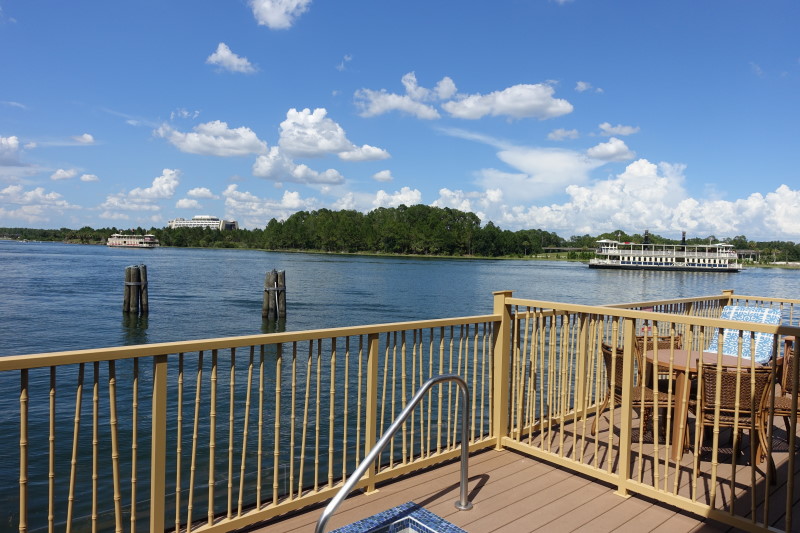
The side view from this deck.
These rooms are an interesting and cool way to put as many as eight people into two bedrooms and a large living/dining/kitchen space at the Polynesian. But for the life of me I can’t imagine spending $3,000 to $5,720 a night on them.
TOPICS IN THIS REVIEW OF DISNEY’S POLYNESIAN VILLAGE RESORT
- Summary and overview of Disney’s Polynesian Village Resort
- Theming and Accommodations at Disney’s Polynesian Village Resort
- Photo Tour of a Standard Room at Disney’s Polynesian Village Resort
- Amenities at Disney’s Polynesian Village Resort
- Dining at Disney’s Polynesian Village Resort
- The Pools at Disney’s Polynesian Village Resort
- The Disney Vacation Club at Disney’s Polynesian Village Resort
- Photo Tour of a Studio at Disney’s Polynesian Village Resort
- Photo Tour of a Bungalow at Disney’s Polynesian Village Resort
OTHER KEY PAGES FOR WHERE TO STAY AT DISNEY WORLD
- Where to stay–the Basics
- Where first-timers should stay
- Reviews of all the Disney World resorts, based on my 150+ stays in them
Follow yourfirstvisit.net on Facebook or Twitter or Pinterest!!
August 17, 2016 No Comments
Most Disney World Resorts Show Surprisingly Low Price Increases for 2017
Disney World’s 2017 resort hotel prices were released on Tuesday.
You can book them by contacting Kelly B at KellyB@DestinationsInFlorida.com or 980-429-4499. Or click here to receive your free quote for 2017.
The Disney Word price seasons for 2017 are here.
I’ve been analyzing a sample of resorts since Tuesday, and the upshot is that compared to hefty price increases that we’ve seen for all components of a Disney vacation going back to the 2016 room prices, the price increases for 2017 are quite restrained.
Only Art of Animation, Port Orleans French Quarter and Port Orleans Riverside see hefty increases. (Reviews of all Disney World resort hotels mentioned in this pricing round-up are linked to from here–I’ve stayed in more than 125 different Disney World hotel rooms, and my reviews are based on these stays.) Other resorts see just low or moderate price increases–including a whole slew of deluxes that see no increase for most or all of 2017.
Analyzing Disney resort price changes is difficult—there’s more than 20 hotels, many differently-priced room and view types within them, seven to nine different major price seasons over the course of the year, additional weekend and holiday upcharges, and more. As a result, unless you have a LOT of time on your hands you need to sample, and that’s what I’ve done.
In general I sample the lowest-priced rooms at all of the resorts and add one higher-priced room type at each deluxe resort, and then analyze:
- Season price increases across all the major Disney World price seasons—e.g. “Regular” season prices for 2017 compared to 2016
- Changes in the dates covered by price seasons that have an impact on price levels—a lot of that happened in 2016, and it’s mostly maintained in 2017
- Changes in the relative price levels of hotels in a single price class—a lot of that happened in 2016, and it’s largely maintained in 2017
For 2017 I sampled 24 room types across the seven major price seasons at the values and moderates and the nine major price seasons at the deluxes. This yielded 396 points of comparison between 2017 and 2016 prices. The detailed results follow.
DISNEY WORLD VALUE RESORTS PRICING IN 2017
Price season structure changes
For 2016, price seasons for later August through the end of October changed from the old “Value 2” to “Fall” in later August and earlier September, and from “Fall” to “Regular” from mid-September to almost the end of October.
In both cases the switch was from a lower-priced season to a higher priced season, in effect substantially raising prices for this period.
In addition, for earlier in 2016, two short periods became “Regular” that used to be “Value” or “Value 2”—in early February and mid-August.
2017 largely maintains this new seasonal structure at the values, but with a couple of twists:
- The early February insertion of a few Regular seasons days has been abandoned, and these days go back to being Value season in 2017–in effect a price cut
- The August Regular season goes on a week longer in 2017 than it did in 2016 before Fall season kicks in–in effect a price increase
- A few mid-December dates that in 2016 were Peak season are Regular season in 2017–in effect a price cut
Price level changes
The basic pattern among value resort standard rooms of Art of Animation Little Mermaid rooms being most expensive and the All-Stars being least expensive continues in 2017.
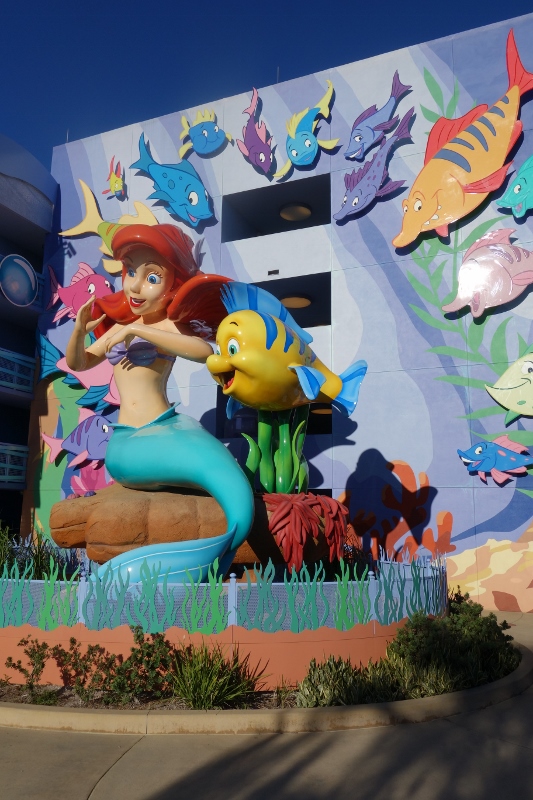
Art of Animation rooms show the highest price increases among these standard rooms in 2017, and the All-Stars the lowest, extending this gap, and putting Little Mermaid rooms shockingly close to standard moderate room prices some dates (especially in the Summer season).
The three Family Suite areas at Art of Animation—Finding Nemo, Cars, and Lion King—had the same prices until 2016. In 2016, Finding Nemo suites became more expensive than the other two, which are priced the same. This price structure among the family suites stayed the same in 2017.
Season price increases
Prices in the All-Stars in 2016 showed no to very low increase compared to 2015. For 2017, average prices in the All-Stars are up a little less than 3%, with the lowest increases in the Summer and Fall seasons and the highest in the Value and Easter seasons. Family Suites at Music are up a little less but show the same seasonal patterns.
Pop Century standard rooms showed no price increases for the Summer or Fall seasons in 2016, and increases of 2-4% in the other 2016 seasons. Increases are higher in 2017, averaging 5.5%, with only the Summer season not showing a moderate or substantial increase.
Little Mermaid rooms at Art of Animation increased 3-5% in the major seasons in 2016, and show much higher increases in 2017–an average of almost 9%, with increases of more than 7% in every major 2017 price season.
Art of Animation Family Suites at Cars and Lion King are up on average 7% for 2017 after low increases in 2016. Peak and Summer prices are up less than 4%, with all other major seasons up 7% to 9.5%. Finding Nemo Suites show an average increase of 9%, with 7% to 10% increases in all major seasons.
DISNEY WORLD MODERATE RESORTS PRICING IN 2017
Price season structure
The moderates saw the same price season structure changes in 2016 as the value resorts did, and the same minor changes to them for 2017. See the material above for more on this.
Price level changes
Until 2016, Caribbean Beach, Port Orleans French Quarter, and Port Orleans Riverside standard rooms had the same prices, while Coronado Springs tracked them some nights and other nights was $3-5 more.
In a major change, in 2016 Riverside and French Quarter became the most expensive moderates. In 2017, after the price changes noted below, Riverside and Port Orleans became even more expensive than the other moderates, and Caribbean Beach and Coronado Springs most seasons are priced the same.
Season price increases
Coronado Springs shows average price increases of 2.5%, with the biggest increases in the Fall and Summer Weekend rates.
Caribbean Beach prices increased an average of 3.8%, putting its rooms at the same prices as those at Coronado Springs in all seasons except the Value and Peak season, when Coronado Springs remains higher.
Prices at Port Orleans French Quarter and Port Orleans Riverside rocketed up 7-9% across all the major seasons, with an average increase of 8%, widening the price differential with the other two traditional moderates that we first saw in 2016.
DISNEY WORLD DELUXE RESORTS PRICING IN 2017
Price season structure
The deluxe resorts run to a different price season calendar than the values and moderates, especially from early July through mid-November.
They did not have the major seasonal date changes that the values and moderates had in 2016. Rather, in 2016 they had only two small seasonal changes, with a few days in early February shifting to Regular instead of Value, and a week in early November shifting to Regular instead of Fall.
2017 shows
- The brief period of Regular prices in early February has been abandoned, in effect a price cut
- There are two extra weeks of Value 2 in August before prices shift to Value, in effect a small price increase
- A few mid-December dates that in 2016 were Peak season are Regular season in 2017–in effect a price cut
Price level changes
There’s a bewildering plethora of price points at the deluxes—many view options, with “Club” service options as well. I only sampled the full set of price changes in fifteen deluxe room types, and based on that saw no material change among the overall resort price standings.
The Grand Floridian is still the most expensive, and standard rooms at the Wilderness Lodge are still the least expensive.
Season price increases
Price increases at the deluxes are shockingly restrained for 2017, so much so that I initially wondered if they were typos. But, at least as of yesterday, these low increases still stand, and people are booking at these rates (Kelly B at KellyB@DestinationsInFlorida.
Of the 15 deluxe room types I analyzed, the average price increase was less than 2%. Six had average increases of 1% or less, and only one (Wilderness Lodge Standard View rooms, which saw hardly any increases last year) showed average increases greater than 3.5%.
Polynesian Village standard view room prices are unchanged all major seasons except for a 1% increase in the Fall Season. Poly Theme Park view prices are up an average of 1%–prices are unchanged in many seasons, up 1% in a couple, and up 3% in the Easter and Fall seasons.
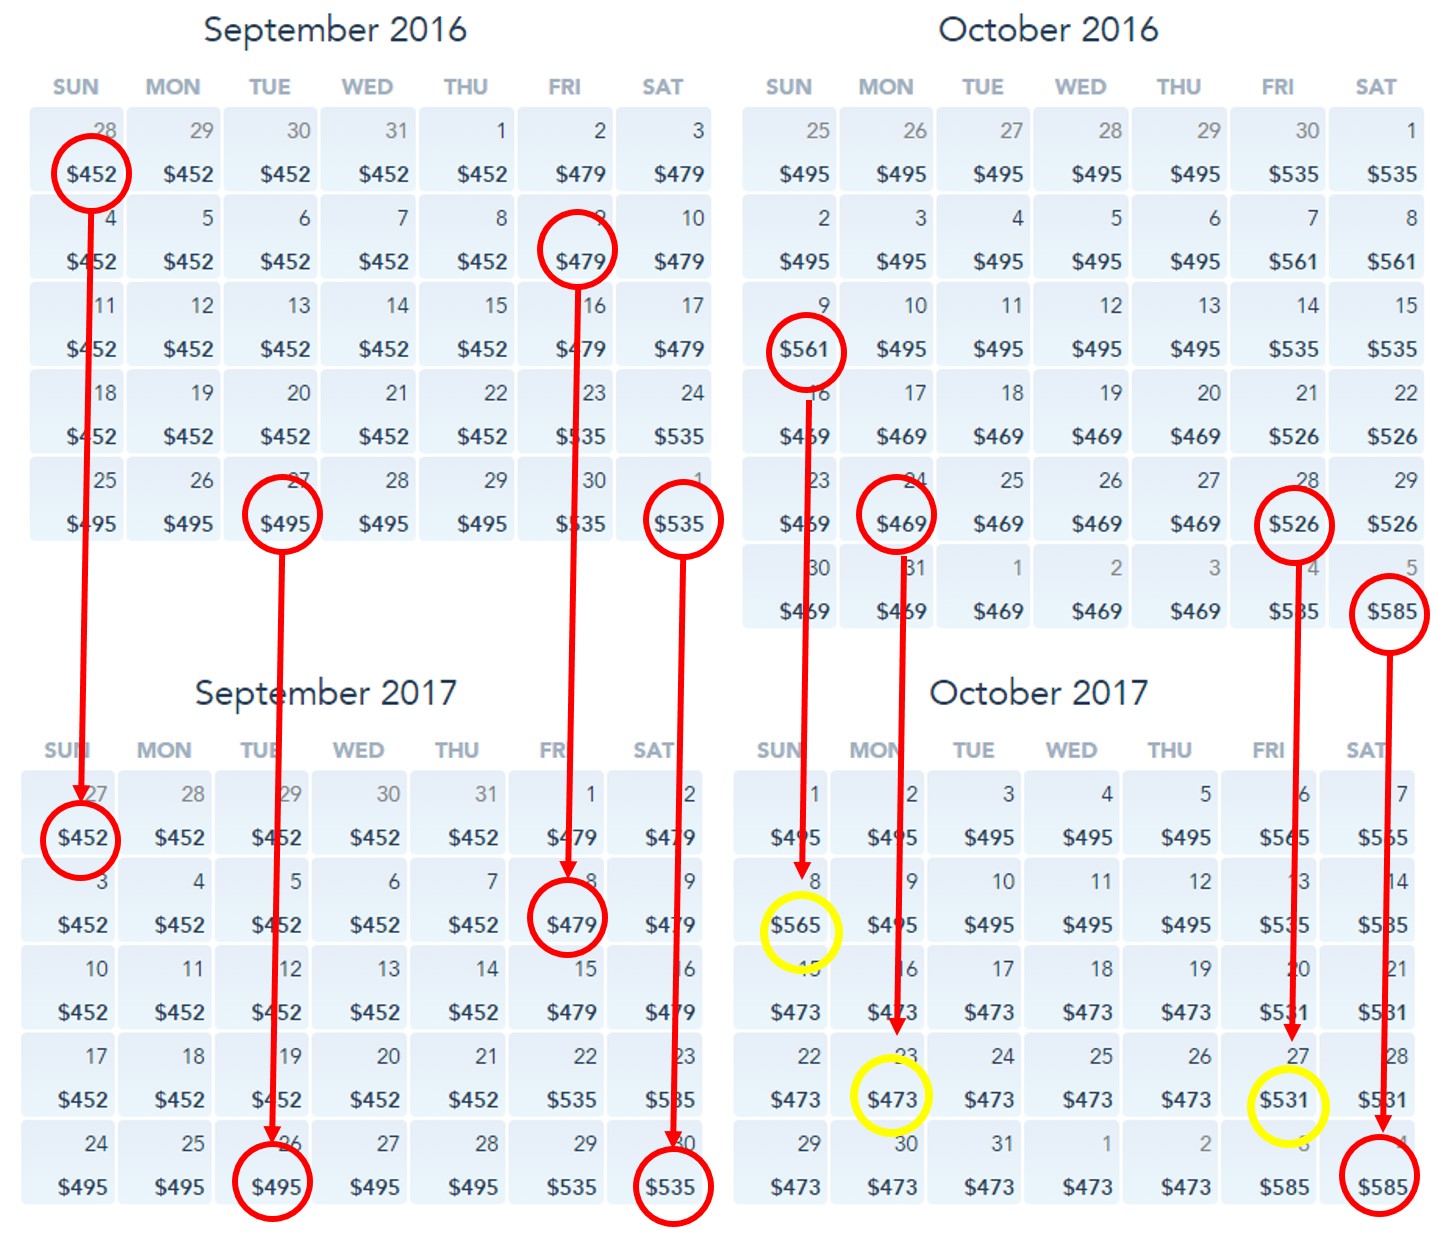
See, for example, late August through early November 2016 and 2017 standard view room prices at the Polynesian:
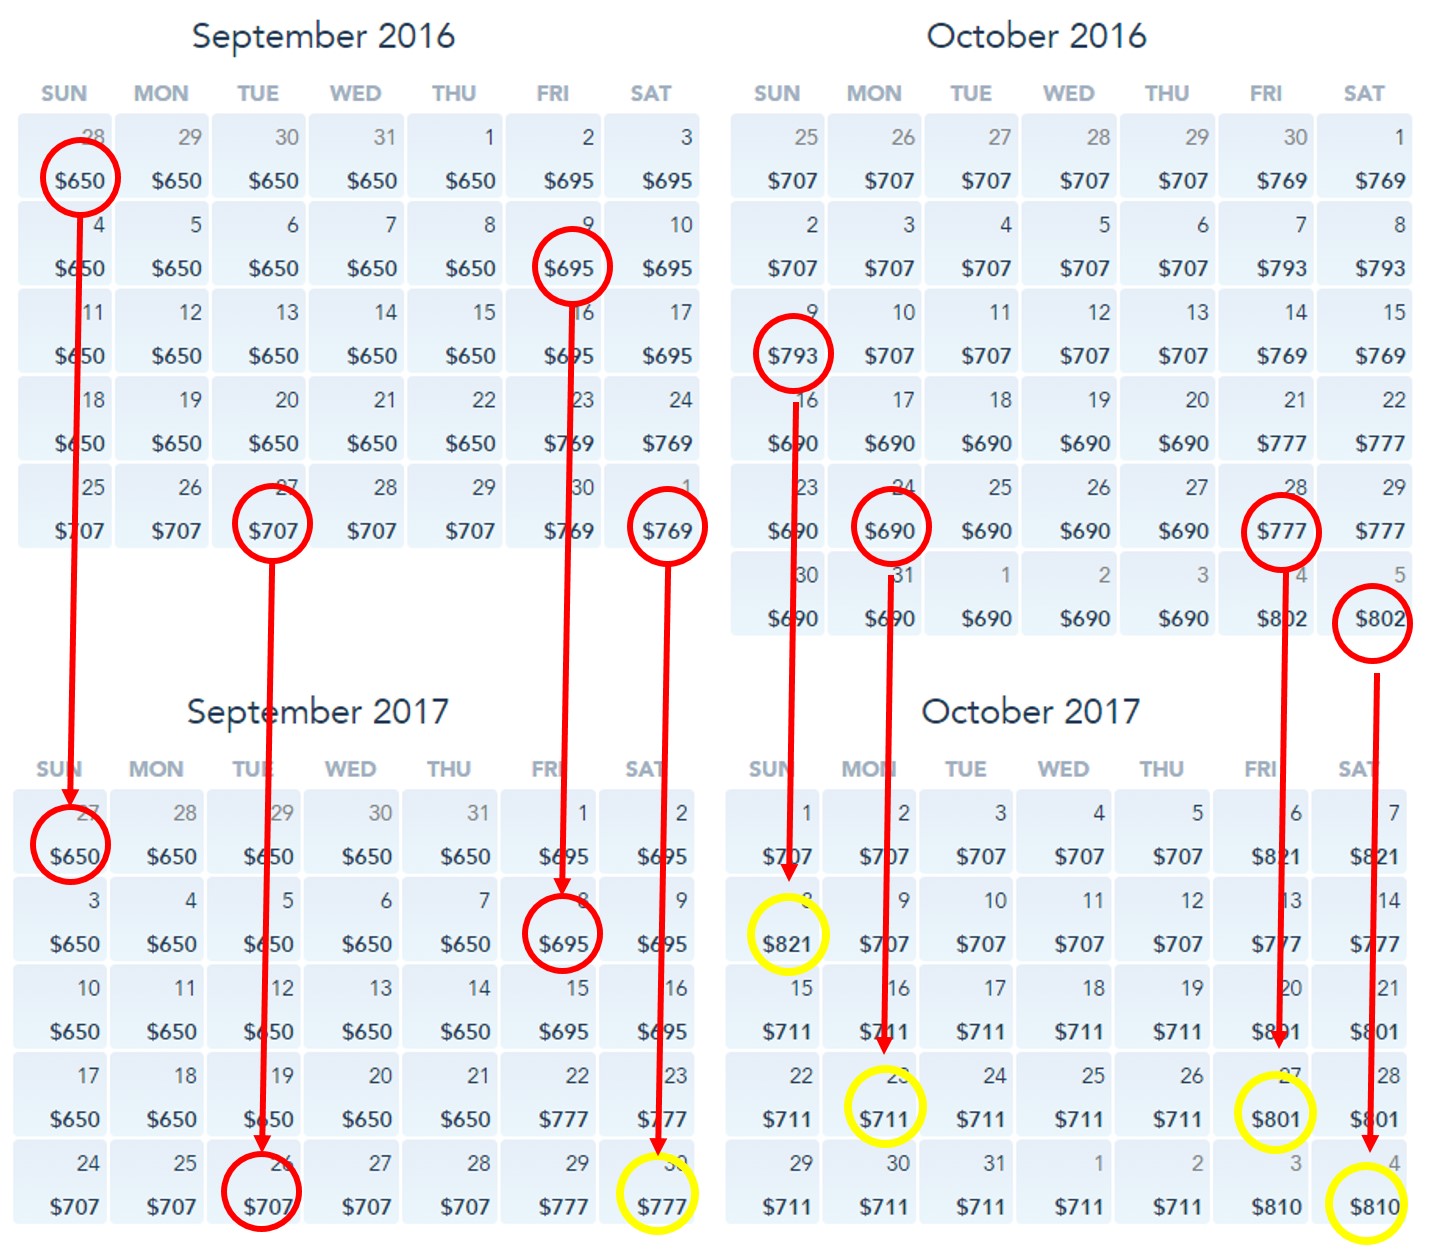
…and Theme Park view prices:
You see across these five seasons (Value, Regular 2, Columbus Day, Fall, and Regular) no change to tiny changes in prices…
Contemporary Resort Tower Bay Lake view rooms are unchanged for 2017 in most seasons, showing only a small (<1%) uptick in the Holiday season. Theme Park view Tower rooms here are up more substantially, averaging 3.4%, with the Peak, Summer and Value 2 seasons showing the lowest increases of around 1% and the Fall and Holiday seasons showing the highest increases of 5.5% to 7%.
Grand Floridian standard view rooms show an average increase of 1.3%, with no or low increases most seasons and 3% to 5.5% increases in the Easter and Holiday seasons. Theme Park view rooms at the Grand Floridian are up an average of 3.4%, with the lowest increases of around 1% in the Peak, Summer and Value 2 seasons, and the highest increases of 5.5% to 7% in the Fall and Holiday seasons.
Wilderness Lodge standard rooms, after next to no increases in 2016, are up an average of 5.4%, with 5% to 6.5% increases across the board except for the Value 2 season, when increases are about 2.7%. Courtyard view rooms here average a 1.3% increase, with most seasons seeing no or less than 1% price increases, but prices up 2.5% to 5.5% in the Value and Fall seasons.
BoardWalk Inn standard view room prices are largely unchanged in 2017, with only the Fall Season seeing a slight increase. Water view rooms here show the same pattern–unchanged in all seasons except for Fall.
Standard view rooms at the Yacht Club and Beach Club are up 3.2% on average. There’s no price changes in the Easter and Holiday seasons, a <1% increase in the Value 2 season, and increases of 3% to 6% in the other seasons. Water or Lagoon View rooms here are up on average less than 1%, with no price increases in the Value, Regular, Peak, and Holiday seasons, and ~1% increases in the Summer, Value 2, and Fall seasons. Only the Easter and Regular 2 seasons see price increases above 1%.
Animal Kingdom Lodge standard room prices are up an average of 2%. The Regular, Peak, Easter, Summer, Fall and Holiday seasons show no changes to less than 1% increases. Value and Value 2 prices are 4% to 7.5%, and weekday prices in the Regular 2 season also increased at that level. Savanna view rooms are up on average almost 3%, with some seasons seeing low increases but the Value, Easter, Value 2, Fall and Holiday seasons seeing increases of 2.7% to (most of the remaining seasons) 5%.
MORE ON THE DISNEY WORLD RESORTS
I’ve stayed in more than 125 different Disney World rooms, suites, villas, and such. Reviews resulting from these stays are linked to here.
Follow yourfirstvisit.net on Facebook or Google+ or Twitter or Pinterest!!
June 26, 2016 No Comments

