
Disney World Crowds in 2016
By Dave Shute
2016 CROWDS AT WALT DISNEY WORLD
 The chart lower on the page shows my forecasts for 2016 crowds by week at Walt Disney World.
Dates in it are the beginning of the week, and the forecast covers the recommended Saturday-Sunday 9 day stays.
(For 2017 crowds, see this, and for 2018 crowds, see this.)
Crowd levels are ranked by week from 1-11 in the following way:
1: Lowest of the year
2: Lower
3: Low
4: Low-plus
5: Moderate-minus
6: Moderate
7: Moderate-plus
8: High-minus
9: High
10: Higher
11: Highest
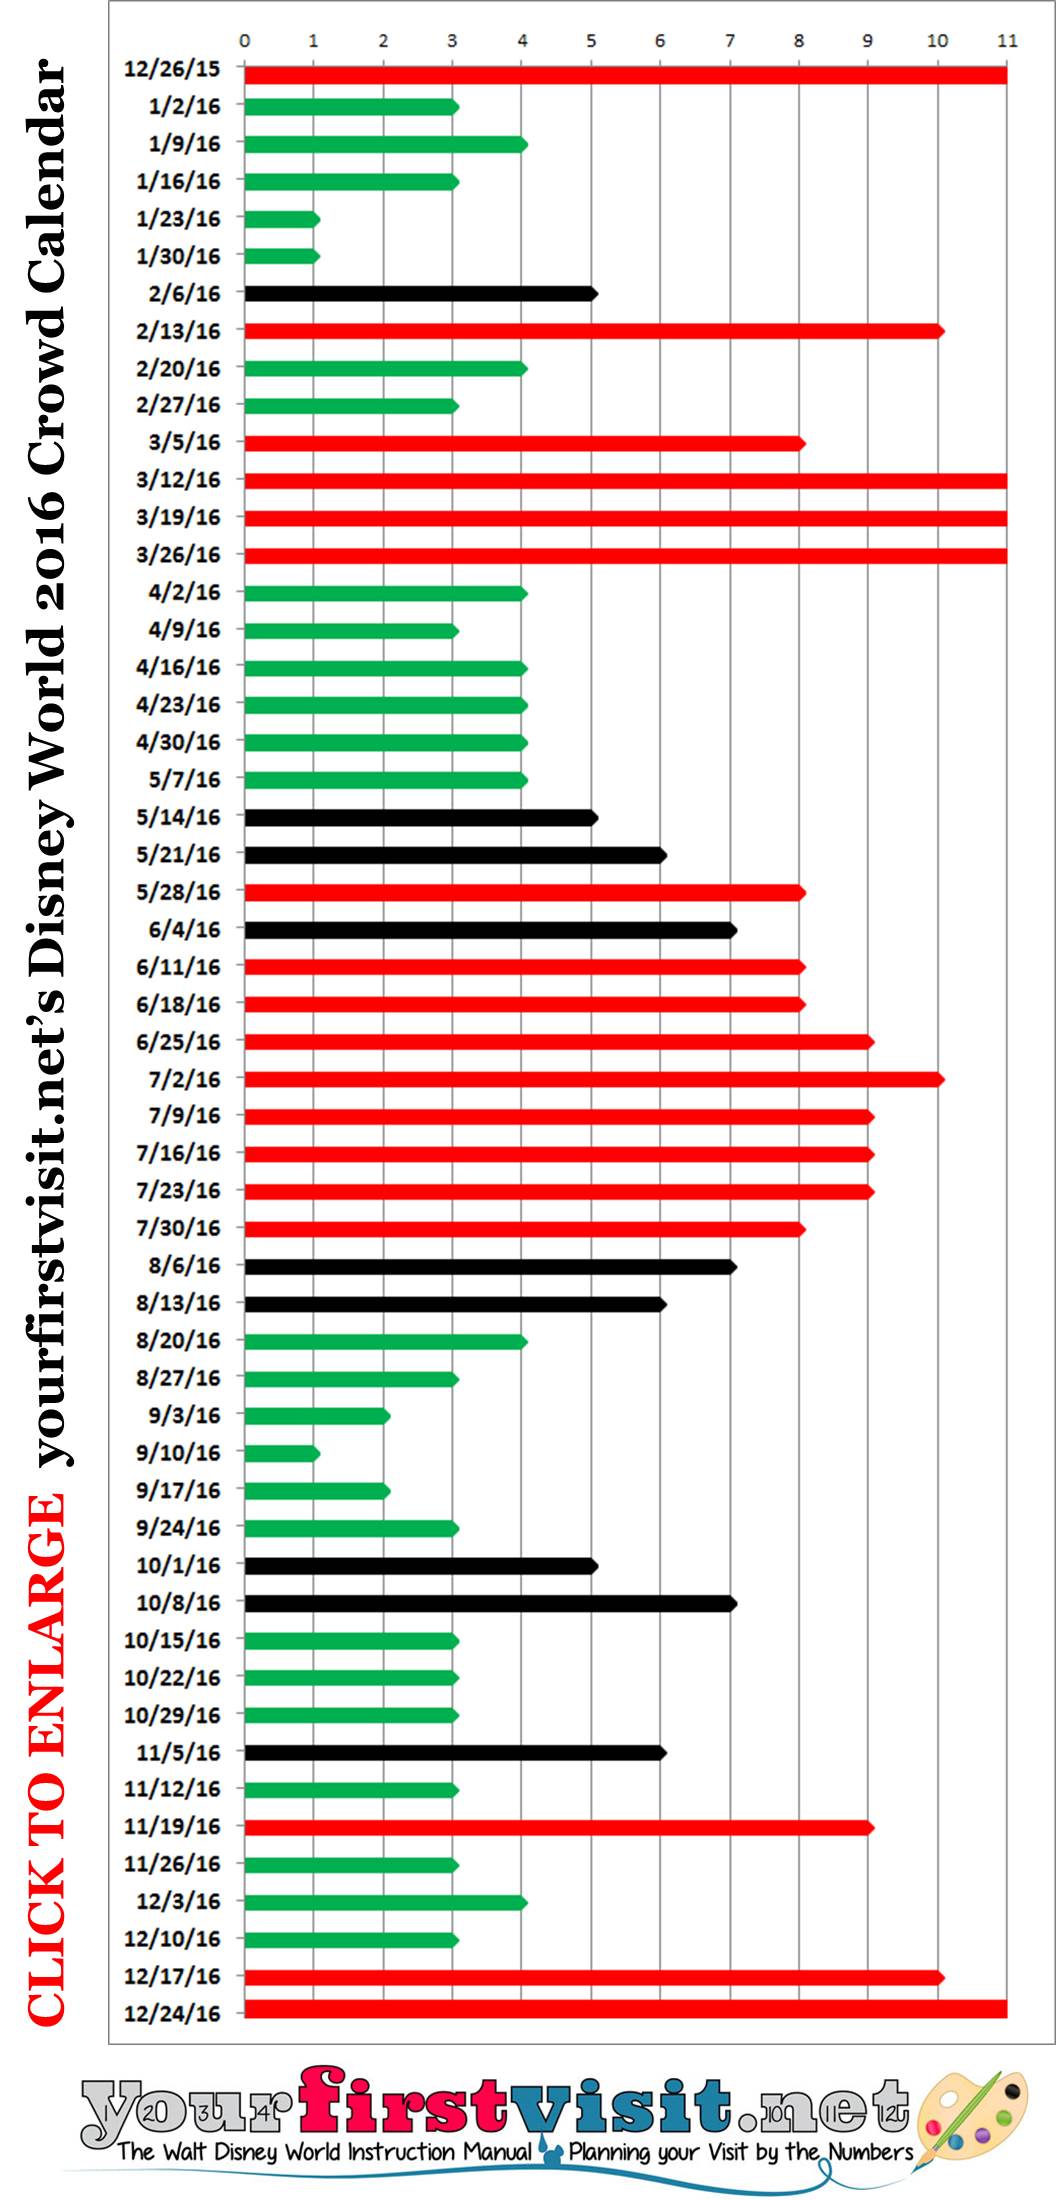
HOW TO INTERPRET THE 2016 DISNEY WORLD CROWD CALENDAR
Dates are the beginning of the week.
The “low crowd” weeks–those colored green, and rated 1-4–represent the only crowd levels a family visiting for the first time, and unsure if it will ever return, should consider.
However, lower crowds, especially lowest crowds, do not always mean a better week. The lowest weeks are often best avoided by first timers who may never return because they are in the hurricane or the ride closure seasons.
The “moderate crowd” weeks–those in black and rated 5-7–have crowd levels I would not particularly recommend to first time visitors, though the crowds can be managed with careful planning and lots of early mornings. However, I’d go during such weeks myself with no hesitation, and think these levels are OK for returning visitors who don’t need to see everything and already know how to work Walt Disney World.
The “high crowd” weeks–those in red, rated 8-11–should be avoided by everyone. They aren’t, which is why they are so high.
MY DISNEY WORLD CROWD CALENDAR GOES UP TO “11”
The influence of the Unofficial Guide and TouringPlans.com has led almost all Disney World crowd calendars to top out at 10.
However, I’ve always thought that the really nastiest weeks of the year deserved an 11 for emphasis.
So, in homage to Spinal Tap, I assigned 11 to “highest.”


Follow yourfirstvisit.net on Facebook or Google+ or Twitter or Pinterest!!


304 comments
Learning so much from you! My daughter and I will be there from October 28 through November 1. Where/when should we avoid and when/where should we go? Thanks for being such a great resource!!!!
Kathy, how old is your daughter?
She’s an adult – our family has been to Disney before but never in October and I am reading so many different things I’m not sure what is the best plan of attack! Thanks for you advice.
Kathy,
10/28 avoid all but AK (MK will be OK, but only if you are eligible for and can make the morning Extra Magic Hours)
10/29 avoid all but HS
10/30 avoid HS and Epcot
10/31 avoid AK
11/1 avoid MK and Epcot
Hey Dave,
My husband and I are planning to take our 6 year old Nov 19-Nov26. He will be in school so that’s the only time we can go. Do you have any suggestions for us?
Cherie, you need really good plans to cope with the crowds. Take a look at this.
Hey Dave, hope all is well on your end.
I read your September ‘forecast’ on crowds. Looks like the week beginning Sept 12th through 15th is the lowest crowds? Anything changed (for crowds) since you did Sept calendar?
Thanks again for all your help over the years!
Mike
Mike, I have no basis for a change to the forecast!
Hi Dave – I know that I am way late in the game for this, but can you review my park plans and let me know if they seem ok? I think I based them on a comment I saw here, but now I can’t find it.
10/23: MK
10/24: Epcot
10/25: MK
10/26: AK
10/27: HS
Thank you!
Leigh: these look great!
Hi Dave, I am extremely happy that I run into your website with such amazing content and you willing to help everybody out like that is fantastic! Keep up the excellent job!!
I have a pretty flexible agenda for April 2017 to visit WDW, however I learned Easter is going to be on April 16th. How does that affect crowds for that month? Do you think weeks of 4/18 to 4/22 or 4/25 to 4/29 sounds like a good idea for less crowded lines and perhaps better deals?
Thanks a lot and cheers from Brazil!
Marcos
Marcos, because of the late Easter avoid the parks until 4/22 or 4/23. See this for more.
Hey Dave.
Had to cancel my trip to WDW this week (Sept 10th – 15th. I know that was the best week in Sept for crowds. Looks like the next best week is Sept 17th – 22nd? The week following, Sept 24 – 29th looks busiest? What ya think….Thanks again for your help Dave!
Hey Mike, crowds will build the rest of the month because of Food and Wine…
We only have two days to spend at Disney World before our cruise. November 10th and 11th. Any advice on what parks are best what days would be great. Thanks!
Shawn, both are good MK days–the 10th better. The 10th is also fine at AK and HS. The 11th avoid Epcot and HS
Hi Dave! Do you think the 12/8 Christmas party will be packed because of Pop Warner crowd? I’ve heard it could sold out because of them. Thanks!
Vivi, Pop comes every year and has no real impact except at its hotels. The parties routinely sell out, but ride waits are still very low.
Thanks, Dave! We’re taking our 2 years old daughter and a 14 years old nephew. We’re thinking:
11/30 Epcot
12/1 HS
Maybe a water park on the weekend
12/5 AK
12/6 MVMCP
12/8 MK
What do you think? Thanks!
Vivi, 12/5 is not a great AK day–could you do AK 12/7 instead?
Yes, thanks!
Hi Dave,
Our family will be visiting Florida December 8- 12. We are spending 3 days at Disney World. Of those days which days would you recommend? And what parks are best if you only have 3 days? Thanks!
Chris, how old are the kids? The answer to which parks depends on that…
Dave, the kids are adults. 🙂
We are going to Disney World 12-19 thru 12-28. Any suggestions on which parks to go to on which days. We will probably spend six days at the parks.
Jeri, it will be wildly busy. Are you staying at a WDW hotel?
Chris, 12-8 avoid Epcot. 12-9 avoid HS and (unless you are staying at a WDW hotel) MK. 12/10 avoid MK and AK. 12/11 avoid HS. 12/12 avoid MK and AK.
You want a day (at least) at MK and Epcot. For your third day you might return to one of these, or go to AK or HS. AK if you like animals, HS Star Wars.
Hi Dave, we are travelling from australia for a disney trip 28 november 16- 6 december 16 (Soon!)with a couple of days on wither end 🙂 I like your crowd calender much better than touring plans who tell me that its going to be really busy especially every day im trying to go to MK.. How do you predict crowds that is different from them? At the moment we ( hubby, me and our girls who are 6 and 10 ) are doing Epcot 28 and 29th nov.. AK 30th, HS december 1st, MK 2nd .. rest day on the 3rd.. MVMCP on the 4th and MK on the 5th.. Days i’m most concerned about is the 5th( rated as a 9 by TP) but almost every day looks either crazy busy or has an early close for MK..
Michelle a fundamental difference is that I predict crowds for a nine day (Sat-Sun) period, and they do it by the day. We also use different scales, so my “4” is more like their 5 or 6.
This time of year there is a profound difference in daily crowding among the parks driven largely by how late MK is open. The scoop on why is here, tho bits are out of date.
You can reason from the link (or just trust me) that Epcot will be crowded the 29th, and indeed MK will be mobbed the 5th. But it’ll be OK the 2nd IF you are staying in an EMH-eligible resort and arrive at the turnstiles well before EMH begins, and you will also see low ride waits at MVMCP. If you manage the 2nd and MVMCP well, and have a good plan and judicious FastPass+ for the 5th, you’ll be fine!!
Hey Dave we were looking at two different dates for first time disney which do you recommend? October 2017 16th-24th or leaning towards October 30th- November 7th the second one more to see halloween and Christmas there ? Your thoughts?
Amber, you’ll see the full Halloween program either set of dates, and only a bit of the Xmas program your November dates–the first Christmas party may happen one of the last days of your visit. (The resorts won’t be decorated, and Epcot’s Xmas program will not have started.) So I would not out too much emphasis on Christmas in making your decision.
Leave a Comment | Ask a Question | Note a Problem