
Category — zz. Even Geekier than Usual
How I Build My Crowd Calendars
My crowd calendars (examples below) are designed to guide first time visitors to WDW who may never return toward lower crowd weeks and away from higher-crowd ones.
My ranking system—in homage to Spinal Tap—goes from 1 to 11, and the “green” weeks (rankings 1-4) are forecast as good choices, “red” (rankings 8-11) bad, and black (5-7) in between.
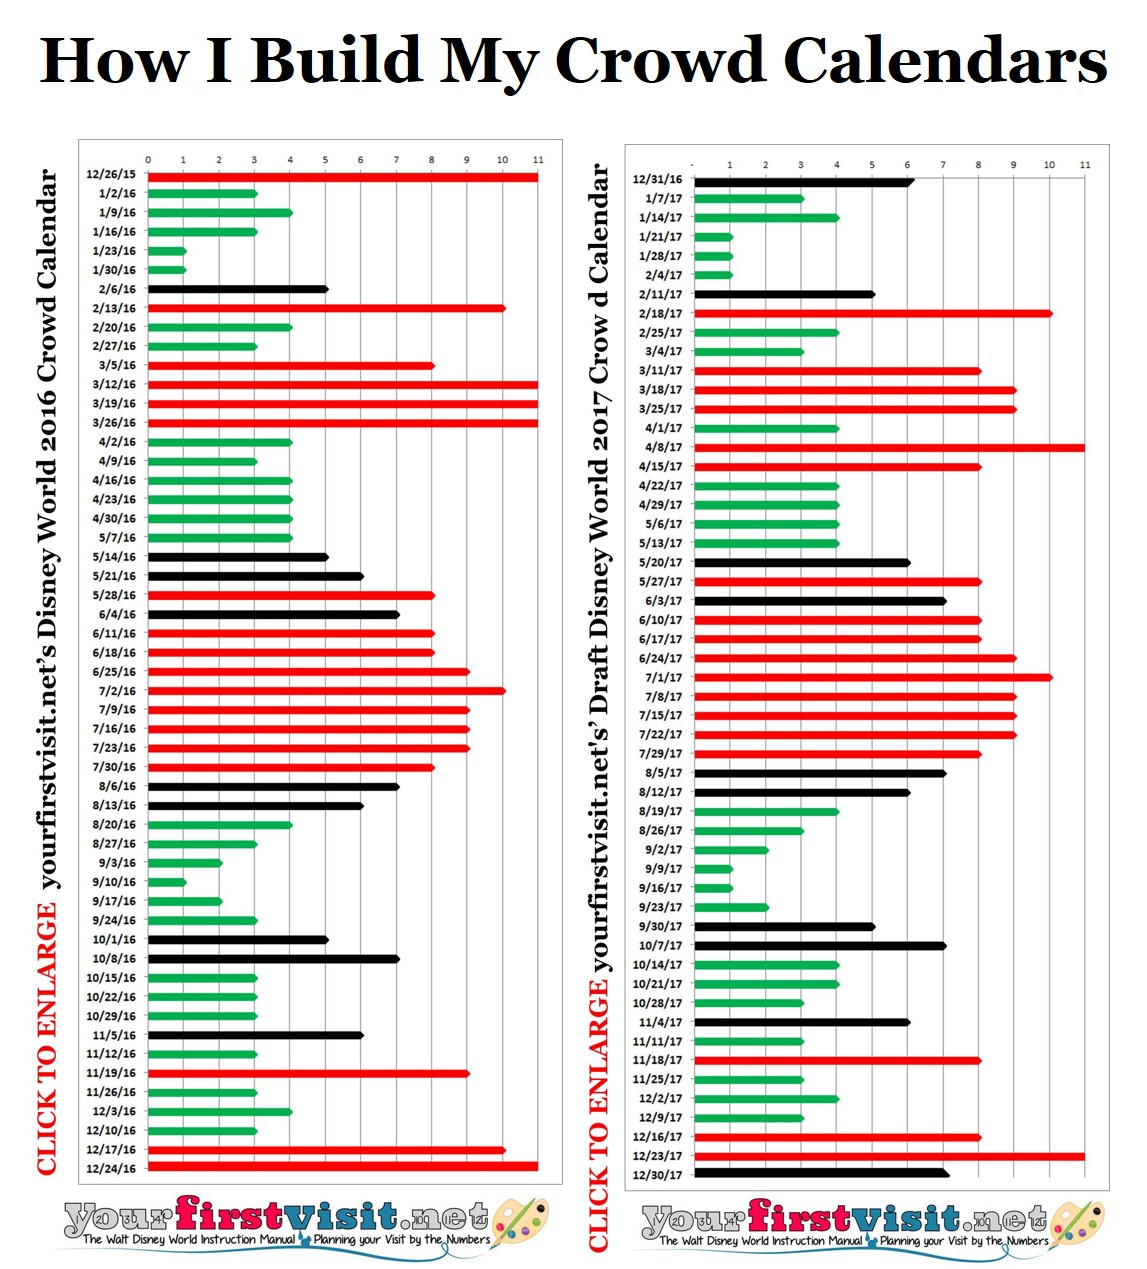
Because I don’t think it helps first timers to be wishy-washy, I don’t aim for a normal distribution, but rather put very few weeks in the “in-between” category. Thus my rankings end up compressed into 4 and below and 8 and above.
Other good crowd calendars that put more of their dates into the center of the ranking distribution will have many more weeks ranked 5, 6, and 7 than I do. The way I try to guide first timers to better weeks, what others will show as average—or even slightly above average—crowds I will show as “low.”
For the same reason, my rankings are ordinal, not cardinal. A ranking of 1 is better than a ranking of 2, but not twice as good.
Moreover they are not tied to the same numbers in prior years—a 3 this year is not the same as a 3 at the depth of the recession. Rather, simply, each year, within the year, I am forecasting that a 3 is better than a 5, and not as good as a 1.
My crowd calendar forecasts are based on two principal inputs:
- Disney World’s own crowd projections, as inferred from the variations in operating hours it offers over the course of the year, as modified by
- Annual analysis of every break longer than a three day weekend for 10 million US schoolkids, weighted based on their propensity to visit Disney World.
When I first started this site, my crowd forecasts were based entirely on variations in operating hours at Disney’s Hollywood Studios and Animal Kingdom parks. (I left out Epcot because it sees fewer many changes in hours, and the Magic Kingdom because I could not figure out how to account for the Halloween and Christmas parties.)
After a few years of building up data, I would forecast the next 6 months based on Disney’s actual schedule and the 6 months after that based on the historic patterns I’d developed, modified for moving holidays.
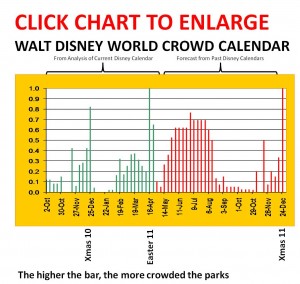
Above is an example of the results of how I used to do it.
This worked OK for a while, but was not sharp enough in distinguishing spring break weeks and the beginning and end of the Christmas/New Years rush in particular.
Moreover it broke entirely later in the last recession when Disney started showing three months of hours rather than six, and then, after it returned to six months, it started showed limited schedules for the out months, with additions to hours coming close to the actual dates.
So in response, I began supplementing my crowd calendars several years ago with annual analysis of all school breaks longer than a three day weekend in ~180 school districts. These 180 districts are the 100 largest districts in the country, supplemented by 80 more large east-of-the Mississippi districts intended to better flesh out states with only a few or no districts in the top 100.
Analytically the way I work with the districts is that I weight districts in a state by kids per analyzed district, and then weight the results for the state based on their relative proportion of visits to this site, as a proxy for geographic interest in Disney World. The state weighting corrects as well as I can for propensity to visit Disney World compared to the distribution of the 180 districts—especially the top 100—across the states.
I use the results to sharpen my forecasts for June, August, the fall, Christmas, the week of President’s Day, and spring breaks. The week of President’s Day and spring breaks are particularly tricky because of higher visitation from snow-birds than either operating hours or school calendars would imply, but with experience I’ve gotten closer on these.
That last point suggests the role of judgement. In a Bayesian sense, my draft Crowd Calendars are the prior based on history, and they then get modified based on the results of the school break analysis, my recent experience (30-60 days in the parks a year, at all different times of the year), history, judgment and help from others—particularly Josh of easyWDW and Carl of Dad’s Guide to WDW and WDW Magazine. (Josh and I co-author The easy Guide to Your First Walt Disney World Visit and within it co-create the crowd material it forecasts, and Carl and I co-author an annual crowd forecast in WDW Magazine.)
There’s no perfection in any forecasting, and I do make mistakes, especially about spring break crowds, where I get a week significantly wrong (more crowded than I predict) on average about once every two years.
Any fool can say “don’t go to Disney World in March or April” and take no risk of complaints. Instead, I try to find spring break weeks that are actually good. Rarely are my suggested spring break weeks ones that have no kids on break—rather, they are ones that are 1. before or after the March snowbird influx that 2. also have relatively few kids on break compared to the mass-break weeks in later March and before and after Easter.
There several ways these forecasts can go wrong.
First is sampling error—that the 10 million kids I analyze aren’t representative of the 40 million I don’t. This is particularly a potential issue when I use city school district calendars as the proxy for a state, and miss different breaks in its surrounding suburbs. These different breaks won’t matter if they match weeks that are already lousy, but they will matter if they match weeks where few of the 180 districts I currently analyze have breaks. I’ll be sharpening this up for 2017.
Second is a change in Disney operations. My forecasts assume that operating policies remain similar year to year. If Disney cuts staffing and per-hour capacity, waits will shoot up even on a day when an average number of people are in the parks.
Third is a differential change in propensity to travel on a given set of dates. There’s a couple of ways this could happen.
- One is a one-time effect from weather. For example a much warmer northeastern winter, or a winter with so much snow that northeastern travel shuts down, may push people from January and February into March and April, because they either don’t need the winter break as badly, or, despite how they need it, transportation shuts down.
- Fall breaks are another possible driver of changes in propensity to travel on a given set of dates. I can’t document that they are a lot more common than they were a few years ago, but what may be happening is that more people are realizing that they are a better time to go to Disney World than the traditional holiday seasons.
This raises another point. My Disney Experience and FastPass+ have made the internet an essential part of a Disney World experience, rather than an optional one. This, plus the fact that the core Disney World first-time planners (parents in their 30s) are in the “always knew about Google” generation may mean that more people may be searching for better and worse times to go, and acting on the advice they find, thus shifting the propensity to travel at certain times.
The final issue any crowd calendar faces is a mismatch of expectations and reality.
All the time I get comments along the lines of “Hey, you said last week was a low crowd week, but we waited 30 minutes Wednesday afternoon for Pirates of the Caribbean! You made a terrible forecast.”
Well, these days an afternoon standby wait of 30 minutes for Pirates is a marker of a low crowd day…


Follow yourfirstvisit.net on Facebook or Google+ or Twitter or Pinterest!!
April 19, 2016 No Comments
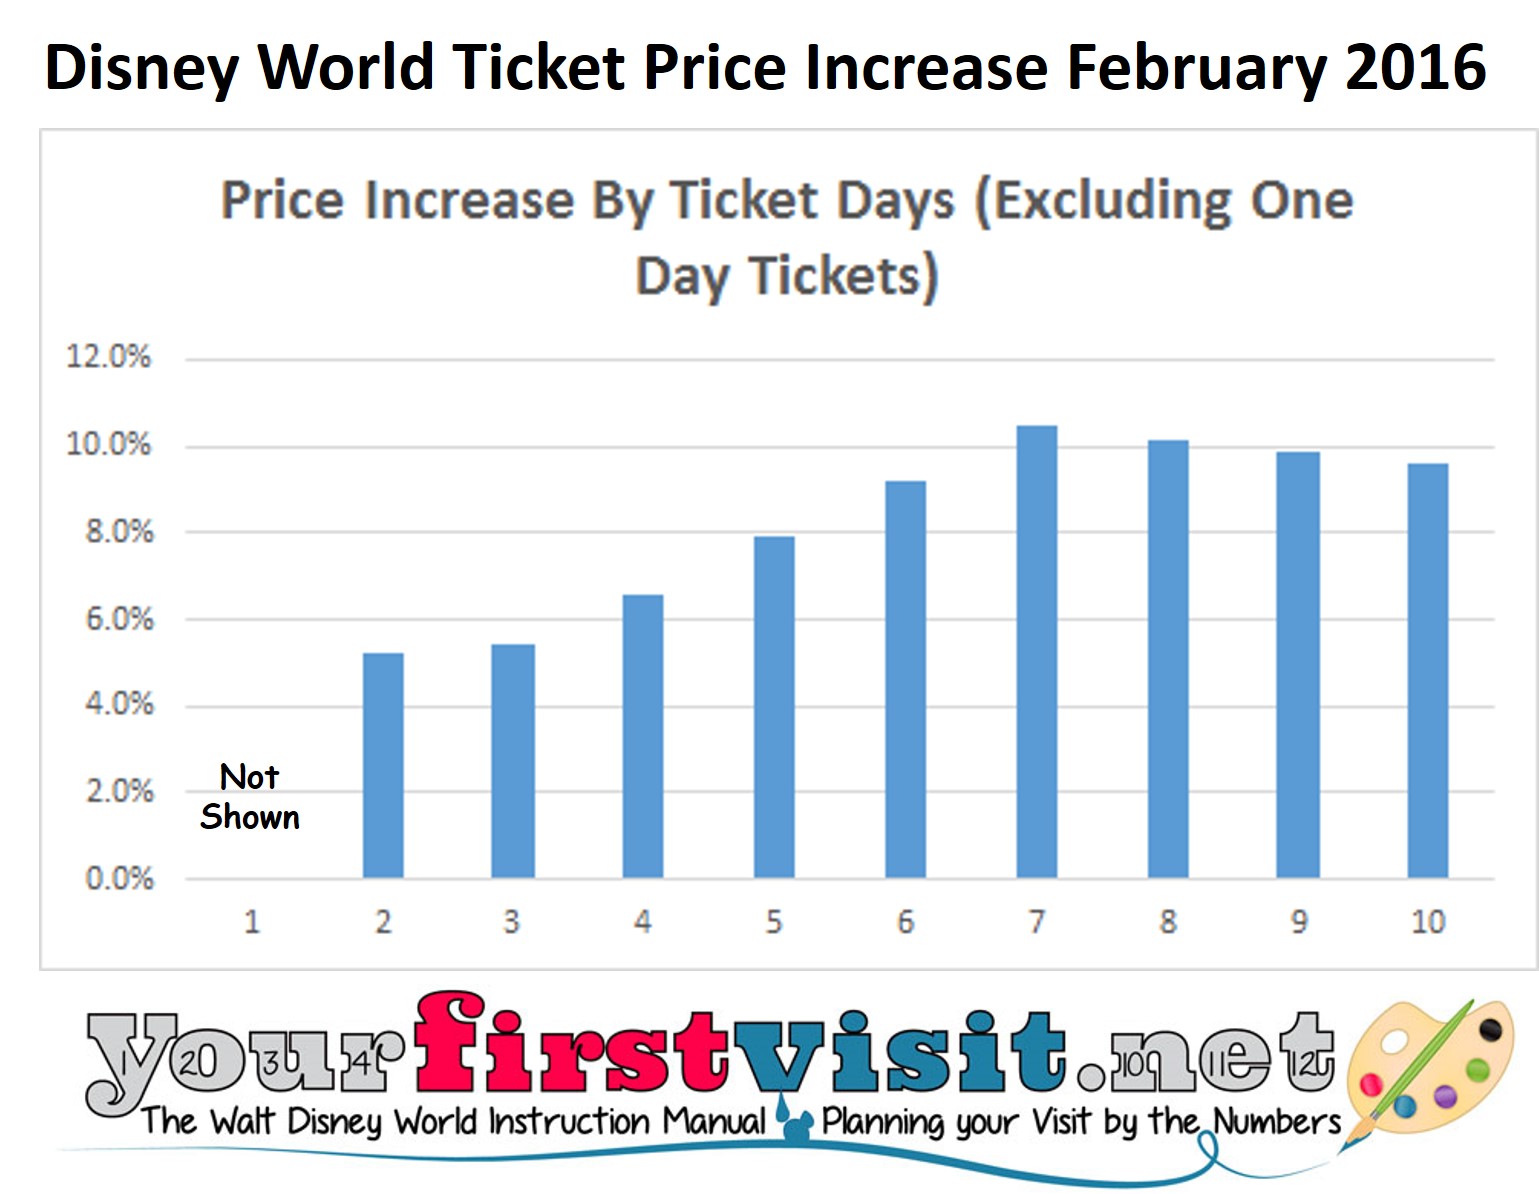
Disney World Raises Prices on Most Important Multi-Day Tickets 8-11%; Introduces Largely Irrelevant Seasonal Pricing for One Day Tickets
Disney World yesterday raised prices on its adult (10 and older) multi-day tickets from 5% to almost 10.5%. Child (3-9 years old) tickets went up even more, from 6% to more than 11%.
The higher price increases were on the five day and longer multi-day tickets that make for the best first visit for those who may not be able to return, and are also the most common tickets for returning visitors.
Price increases by length of ticket (except for one day tickets) for adult tickets are in the chart:
In addition, while it is still relatively inexpensive to add days to a ticket at least four days long, there’s now two prices for adding days to such tickets. For shorter tickets, it costs around $16/day, and for longer tickets, $10.65.
The full data on the new ticket prices is here.
At the same time, Disney changed the form of its one day tickets.
- One day tickets still have different prices for adults and children, and (unlike any other ticket lengths) still have different prices for the Magic Kingdom vs the other three parks.
- Now, in addition, one day tickets (but not any multi-day tickets) have different prices at different times of the year, creating more than 70 bazillion different possible ticket prices for these largely irrelevant one day tickets.
WHY THE BIG PRICE INCREASE AND MINOR SEASONAL PRICING ADD?
My speculation is that both of the curious features of the new prices are strategic–that is, they are about the future, not about 2016.
The high increase in ticket prices for 2016 follows a high increase in 2016 resort prices that came out last summer. Both are trading off an increasing US willingness to spend on vacations now that we are years out of the recession with major exchange-rate issues for overseas visitors, in the context of the Disney hotels being for all practical purposes full, Magic Kingdom capacity a constraint to growth many weeks of the year, and a whole sequence of new attraction investments coming on line this spring, this summer, and next year.
I see this year’s minor stab towards seasonal ticket pricing as simply being the first shot at this seasonal pricing model.
That is, I believe that next year–or sooner, or a little later–seasonal ticket pricing will become more general across Disney World ticket types, as Disney tries to get people into the parks more in the lower-demand periods of the year. Until something relieves pressure on the Magic Kingdom during busier times, and additional hotels get built, that’s where volume growth has to come from.
The high increase this year lets the increases next year in the lower-priced seasons of the year be less, zero, or even a cut, while still showing a good two-year average growth, allowing for a wider band between the lowest and highest cost ticket dates.
Follow yourfirstvisit.net on Facebook or Google+ or Twitter or Pinterest!!
February 29, 2016 No Comments
Quick Update on the Fort Wilderness Cabin Refurb
I’ve published a full photo tour of the renovated Cabins at Fort Wilderness beginning here, bit, but here’s a quick update on the Fort Wilderness Cabin refurb:
REFURB SCHEDULE FOR THE CABINS AT FORT WILDERNESS
- Loops 2200, 2300, 2400, and 2600 are done
- Loop 2800 is closed for refurb, and expected to re-open in early March
- Loop 2700 will close for refurb in early February, and re-open at the end of March or early April
- Loop 2500 will close in mid-March, and re-open in mid-April
- Loop 2100 seems to still have the uncertainty already noted here
These plans are subject to change, of course!
THE NEW OVENS IN THE CABINS
As noted here, the regular oven in the Cabins has been replaced with a combined microwave/convection oven.
I put it through its paces yesterday and Saturday, and here’s the basics:
- It won’t go hotter than 425 degrees, so no broiler, and recipes that need 450 will take longer and may brown more slowly than you want
- There’s only 6 inches of space between the top of the rack and the top of the oven, so no tall food (The inside dimensions are 21 by 14 inches–it’s plenty long and wide, just short.)
- Everything I baked took 15% to 50% longer than I expected
- The controls are a little tricky at first–more microwavish than ovenly
There’s more on how the new ovens at Fort Wilderness performed here.
Follow yourfirstvisit.net on Facebook or Google+ or Twitter or Pinterest!!
February 1, 2016 No Comments
Cheat Sheet for Walt Disney World in 2016
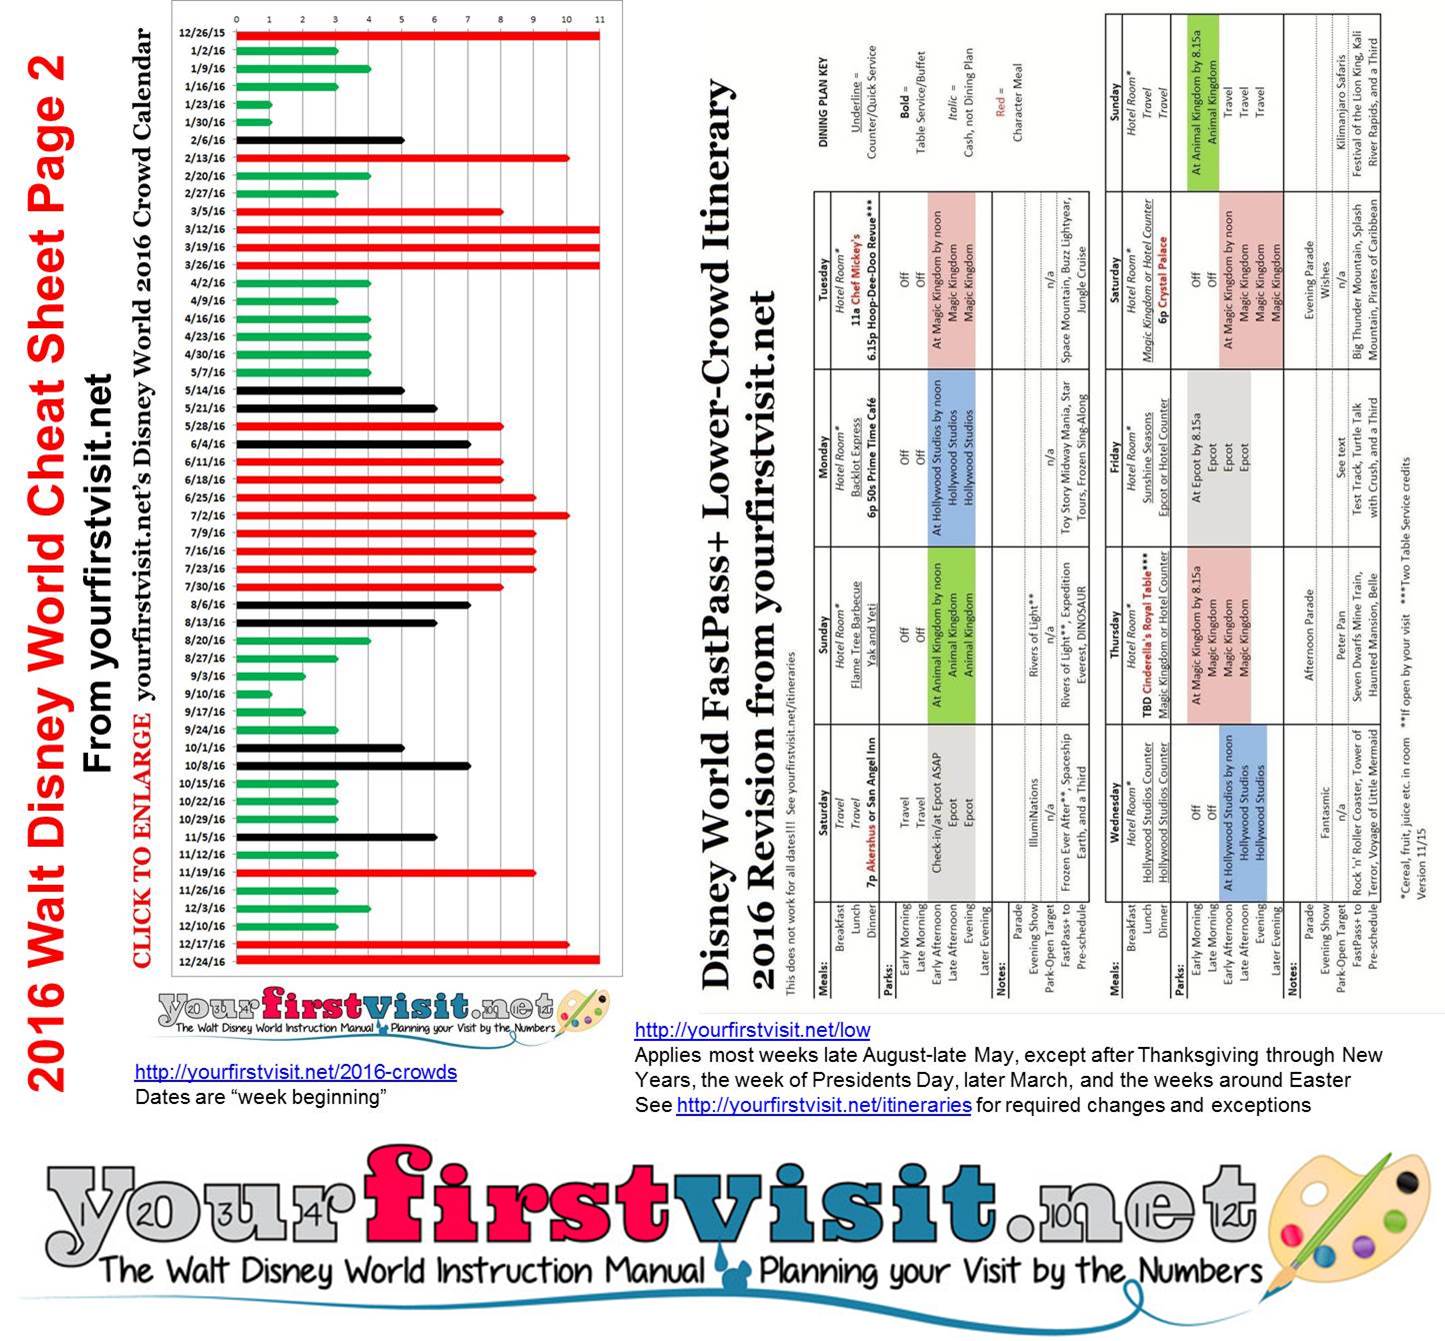
My five-page 2016 Walt Disney World Cheat Sheet–an example page is above–includes a number of this site’s famous charts and graphs.
In total, the cheat sheet provides the key data you need for planning your 2016 first family visit to Walt Disney World.
Click here to open it as a PDF–it’s 1.64 MB, so might take a bit.
Follow yourfirstvisit.net on Facebook or Google+ or Twitter or Pinterest!!
January 1, 2016 16 Comments
Avoid–For Now–Orlando.com
I don’t usually warn people off of bad stuff—life’s too short, so mostly I just ignore it.
For example, there’s a Disney Word guide book out there from a famous publisher that claims “Since Disney’s Animal Kingdom now opens at 8 a.m. almost every day, you can see the park in half a day.” Neither of these claims is true (except in the trivial sense that if you skip half of the Animal Kingdom, you can see it in half a day). Rather than warn people off, I just didn’t bother to review it.
Today I’m making an exception because the influential Orlando Sentinel published an article about a new website (from hotels.com) called Orlando.com.
I looked at the new website and was appalled.
Just a few issues I found on it:
From its material on Magic Kingdom park hours and the evening fireworks show Wishes:
“Magic Kingdom Park at Walt Disney World is open every day from 09:00 to midnight…The Wishes nighttime spectacular firework display also runs every evening at 22:00.”
The Magic Kingdom’s operating hours aren’t “from 09:00 to midnight,” but in fact vary substantially, especially in later September through mid-December.
It can be open as long as from 8a until 1a, or as briefly as 9a to 7p (even 6p one or two nights a year).
This week, its operating hours are as follows: 8a-12MN 10/10, 9a-11p 10/11, 9a-7p 10/12 and 10/13, 8a-11p 10/14, 9a-7p 10/15 and 10/16, 8a-12MN 10/17, and 9a-7p 10/18. Note that on not a single date this week is it open “from 09:00 to midnight.”
Wishes does not “run every evening at 22:00.” First, it’s not on every night of the year—it’s on just four nights between 10/10 and 10/18—and while commonly shown at 10p, is also shown some nights at 8p or 9p, and even more rarely 7p.
From its material on attractions at the Magic Kingdom:
“Check out the best attractions at each of these zones below:”
“Adventureland – inspired by the tropical jungles of Africa, Asia and South America, this is the place to delve into the deep, dark world of ‘Pirates of the Caribbean’, float down the river in the ‘Jungle Cruise’ simulator, or go wild in the long-standing ‘Enchanted Tiki Room’.”
“Fantasyland – this recently-expanded part of Magic Kingdom is inspired by the medieval fayres and carnival featured in Walt Disney’s movies. Top rides and attractions here including the more child-friendly ‘It’s a Small World, ‘Peter Pan’s Flight’, ‘Seven Dwarfs Mine Train’ and ‘Tangled’.”
Not sure that the Jungle Cruise is a simulator; not many would highlight the Tiki Room as either a “best attraction” or a place to “go wild”; and in Fantasyland, “Tangled” is a bathroom, not an attraction.
From its ticket price material on the Magic Kingdom (typos and grammar problems from the original):
“Do not that tickets are sold separately for Disney’s Magic Kingdom, with day-passes starting at around $100. You can then upgrade your ticket to the ‘Park Hopper Option’ which grants access to all four parks at an additional cost $64 per day.”
The park hopper upgrade is not priced “per day” but rather has a single one-time cost that varies by ticket length. A park hopper costs in total (after tax) about $68 for all ticket lengths longer than three days. It’s $53 if added to a one day MK ticket, $62 if added to another one day ticket, and $53 for two and three day tickets.
From its material on When to Go—oddly buried under “Weather”
“Peak Seasons:”
“There are two times every year when Orlando is really busy with tourists …[that] coincide with the school holidays – spring break in March and April and the summer vacation from June to September.”
“Low Seasons:”
“…[T]he tourist numbers (and, as a result, hotel prices) are at their lowest…during the winter months from November to March.”
In fact, the “winter” weeks that include Christmas and New Year’s Eve are the busiest and highest-priced periods of the year, and March other than the first week is both very crowded and expensive.
The site also has a number of “Top Ten Lists” which seem to be simply crowd-sourced with some questionable editorial matter then added.
For example, in its “Ten Best Restaurants” entry, it (not unreasonably) puts Victoria and Albert’s at #3, but begins its commentary with this odd text:
“Fine dining and Disney haven’t always gone hand-in-hand; the first restaurant you might associate with Mickey Mouse and co probably has a giant yellow ‘M’ towering above it or a certain Colonel Sanders plastered on a billboard outside. Victoria & Albert’s, however, flips this now out-of-date stereotype on its head, offering the polar opposite of the old-school Disney fast food joint.”
And then, most tellingly, comes Orlando.com’s proposition for the Number 4 Best Restaurant in Orlando: The Cheesecake Factory!
Enough said.
This website may be of some use, someday. But for sure it is not now. Ummm…get my book instead.
Follow yourfirstvisit.net on Facebook or Google+ or Twitter or Pinterest!!
October 14, 2015 3 Comments
Why Disney World Deals Are So Hard to Find
 In recent years, Disney World has offered deals most parts of the year.
The most common deal is discounts on its hotel rooms, but now and then it also offers package deals, such as the dining plan for free to those who book a hotel room and tickets at full price.
In 2015, however, several major deals in a row have been hard to book, especially for the least expensive “standard” rooms: the fall free dining deal (now closed), and room rate deals for early and later fall (both still open).
Why are these deals hard to book? Because Disney is making many fewer rooms out of its inventory available for the deals. And why is it doing that?
Because it can get really good occupancy and rates even without the deals.
A week and a half ago Disney reported its Q3 earnings and (in its earnings call) hotel trends for the current quarter. In its 10Qs it also includes available room nights, occupancy, and per-room guest spending.
For Q3 2015 (basically April to June) it reported 2.6 million available room nights at 87% occupancy with an average spend of $310 per night.
Multiply them together, and that’s more than $700 million in domestic hotel revenue, Disney’s highest results ever, and nearing twice the worst quarter of the recession, Q2 2009 when hotel revenue was just a bit over $400 million.
Seasonality can muddle Disney’s trends, but using a four quarter moving average clears out seasonality.
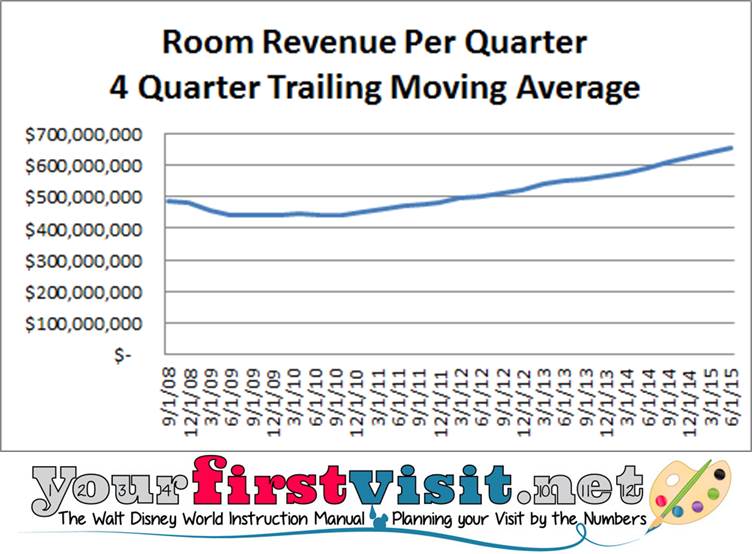 The chart above shows the results of this analysis.
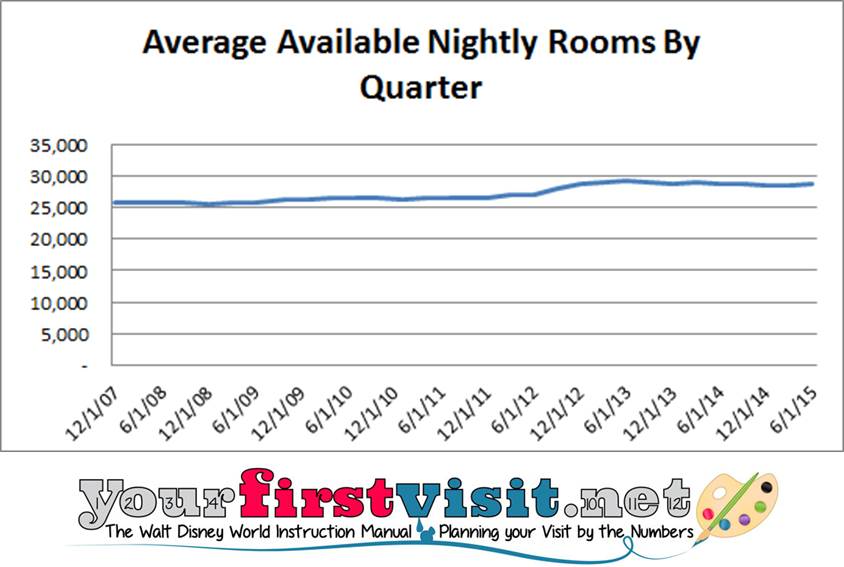 It combines the effects of available rooms, which vary from both new construction and rooms taken out of inventory for refurb…
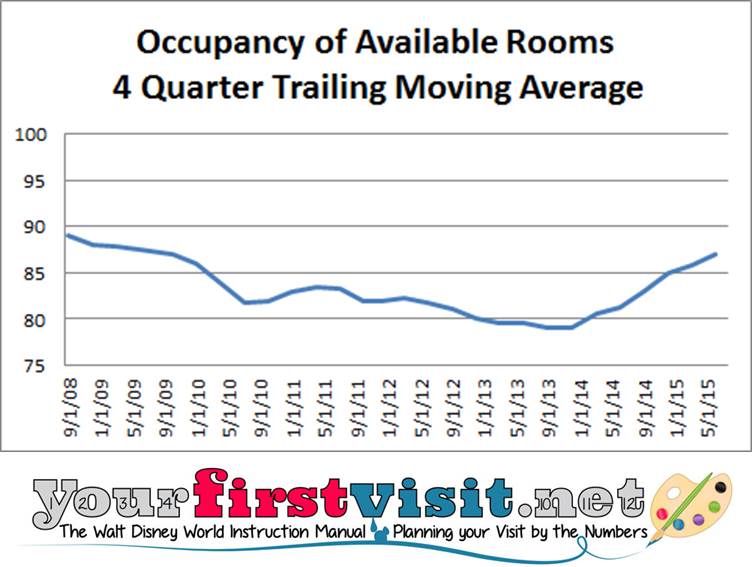 …occupancy…
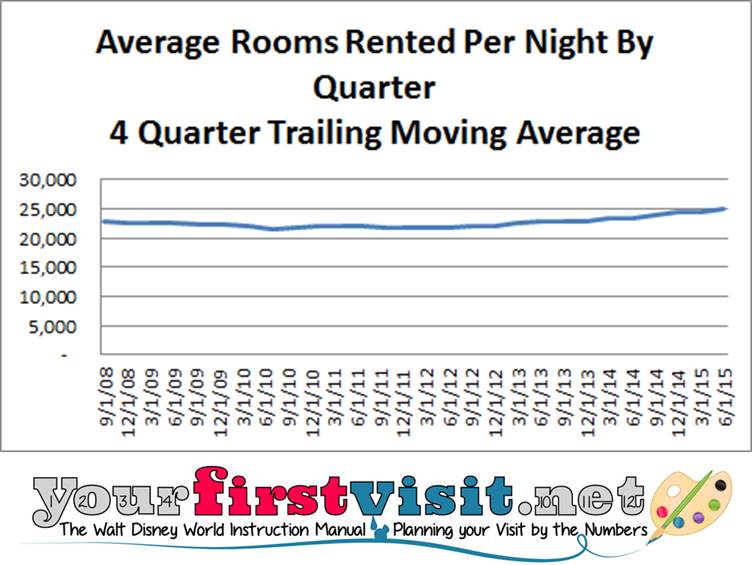
…which then results in booked rooms (multiplying available rooms by occupancy)…
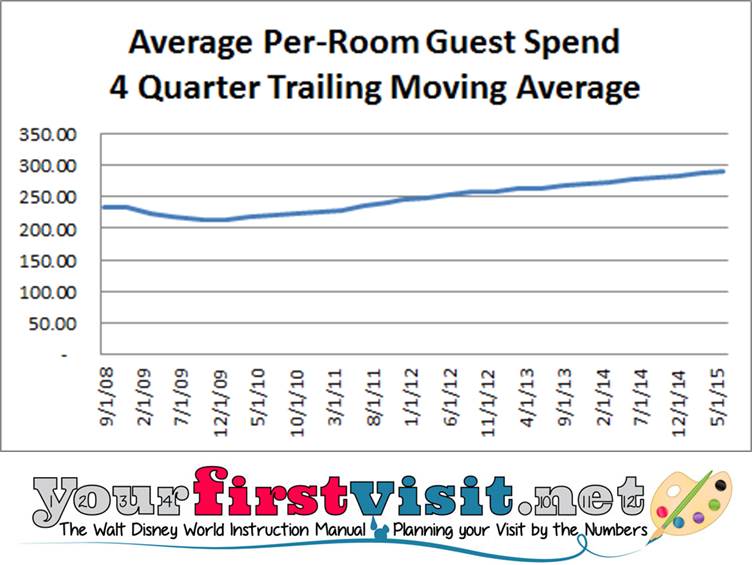
…and is multiplied by guest spend per room to yield actual room revenues per quarter.
Disney is a public company–which means it has the job of increasing earnings. How do you increase earnings when your hotels are booked almost to capacity?
Well, one way to increase earnings when you don’t have a whole lot more rooms to sell is to cut back on the number of discounted rooms you offer…
Follow yourfirstvisit.net on Facebook or Google+ or Twitter or Pinterest!!
August 17, 2015 No Comments