Category — Disney World Crowds
Pro Bowl, Presidents Day, and Mardi Gras Crowds at Disney World
DISNEY WORLD CROWDS AND THE PRO BOWL
In 2017 for the first time Orlando will be hosting the NFL’s Pro Bowl, on January 29. The game itself will be in downtown Orlando’s “Camping World” Stadium, which some of you may remember as the Citrus Bowl, but Disney World–especially, but not only the ESPN Wide World of Sports area–will be heavily involved.
According to NFL.com,
“Practices will be held at the ESPN Wide World of Sports Complex at Walt Disney World Resort simultaneously with youth football events and a fan fest…There will be a Pro Bowl-themed 5K run, a parade of Pro Bowl players in the Magic Kingdom and Pro Bowl-themed elements throughout Disney Springs, Disney’s newest entertainment and dining destination.”
This is a new thing, so there is no track record to base crowd predictions on. Wide World of Sports–and the roads near it–will be mobbed during the fan events the days before the game, as will also, I’d guess, the Magic Kingdom on the as-yet unannounced day of the parade there.
Predicting resulting overall Disney World crowd levels the weeks before and after the game is a little harder.
- First, the Pro Bowl itself is not much of a destination event. The announced figure of “at least” $30 million economic impact on the Orlando area implies at the low end just 10,000 to 20,000 incremental people in Orlando from the Pro Bowl (based on rules of thumb about the value of an out of town visitor I learned at one of my clients), which is nothing when spread across all of Orlando’s attractions.
- However, the Pro Bowl has never been held in collaboration with Disney World and ESPN before, so it and more importantly its fan fest might end up being a real draw to people from out of town.
- It may especially be a draw for folks within easy driving distance–the Orlando area itself, of course, and Jacksonville and Tampa–to combine a day or two at the fan fest and at the theme parks. (The “easy drive” might even include the arc from Mobile through Atlanta to Charleston, and all of South Florida as well.)
We won’t really know until after it happens, but we can say for sure that the Disney World hotels will likely be booked solid the week before and perhaps a few days after the game, and that the parks will likely be somewhat more crowded than I’d predicted before the Pro Bowl was announced.
My original crowd forecasts for the week leading up to and the week after the Pro Bowl weekends were both 1/lowest crowds. Because the only number I have is the quite low $30 million in incremental economic impact, I’m not raising these a lot. In my 2017 Disney World crowd calendar, I am now forecasting the week before the game as 4/low+ crowds, and the week after as 2/lower crowds.
DISNEY WORLD PRESIDENTS DAY CROWDS
Based on the comments I get on this site, year after year one of the things that most surprises people is how crowded the week of Presidents Day is at Walt Disney World.
Most schools just have one day off–the Monday holiday.
However, even so, lots of other school kids have a four or five day weekend (Thursday or Friday to Monday, or Saturday to Tuesday or Wednesday).
Even more have the whole week that includes Presidents Day off. Most of the latter are from the Northeast, and really, really need a break from the snow and cold…and thus the massive crowds that week at Disney World!
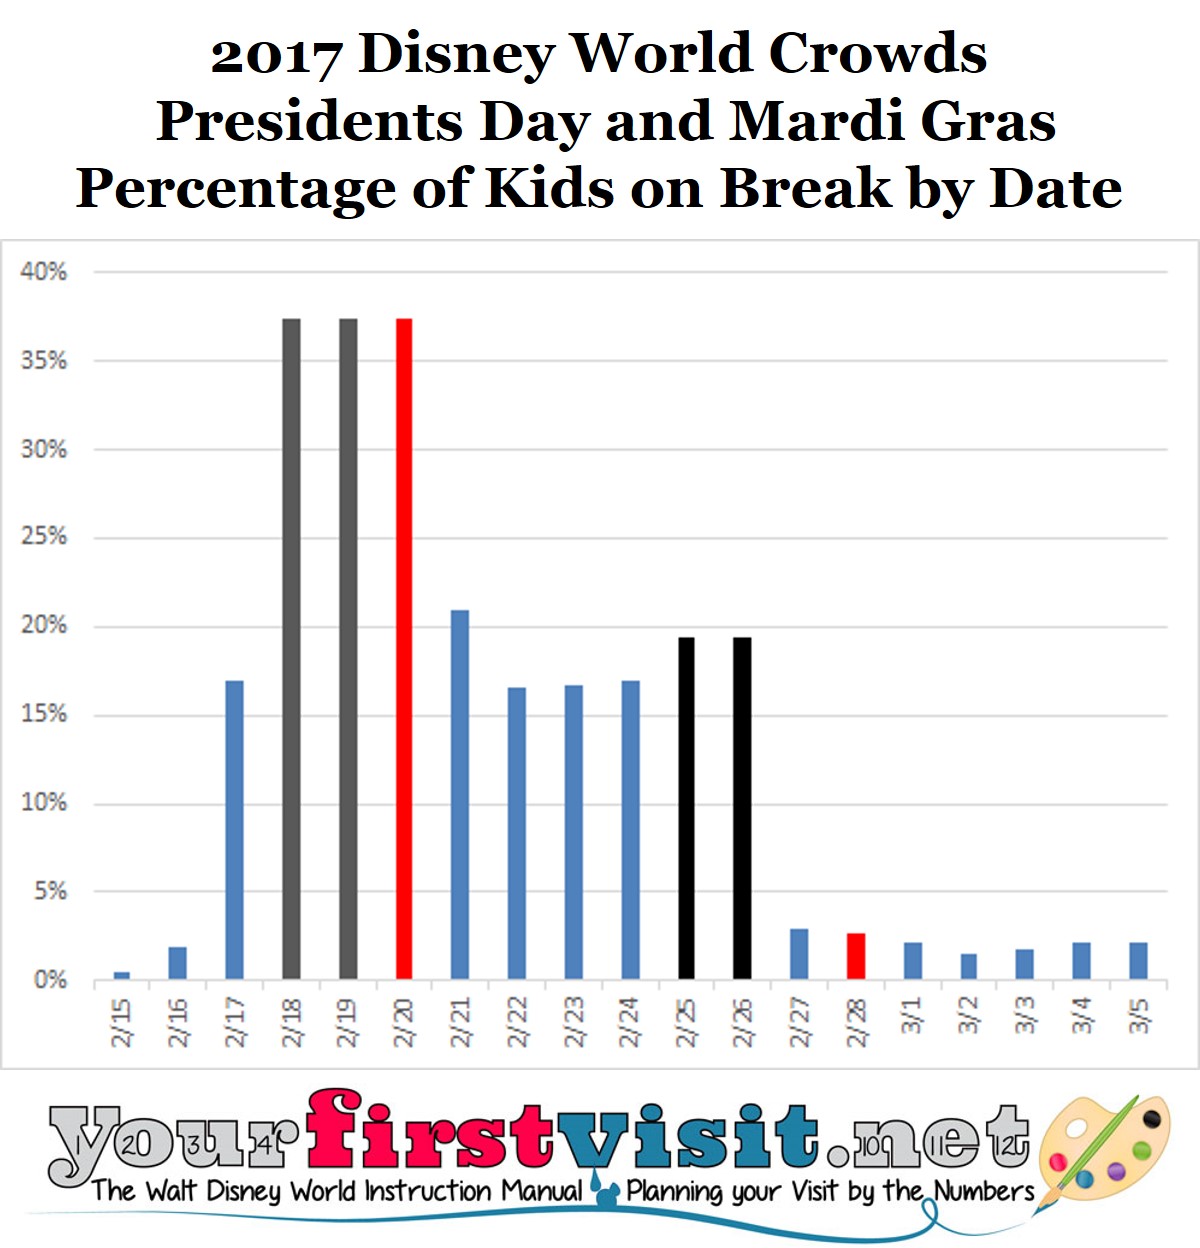
See the left side of chart, which shows the proportion of the 15.4 million kids in my 2016-2017 school year calendar database with more than a three day weekend over President’s Day:
In 2016 Presidents Day is February 20th, shown in red.
Breaks begin the Thursday before, and continue at high levels through the rest of the week.
In my 2017 crowd calendar I have the week that includes Presidents Day rated as 10/higher crowds. Expect the highest crowds Friday through Tuesday, and high crowds the rest of the week.
MARDI GRAS CROWDS AT WALT DISNEY WORLD
Mardi Gras, February 28 in 2017 and in red on the right side of the chart, is the opposite. My commentors worried about it tend to come from the very few southeastern areas that have a multi-day holiday around it. But hardly anyone else does.
So Mardi Gras has little effect on February crowds unless it falls (as it did in 2015) the day after Presidents Day, in which case it makes a lousy week even more horrible.
In my 2017 crowd calendar I have the week that includes Mardi Gras rated as 4/low+ minus. This rating combines moderate crowds at the beginning of this week from leftover Presidents Day folk, a runDisney event, and Mardi Gras itself, with quite low crowds later in the week.
(For how these charts are built, see this.)
Follow yourfirstvisit.net on Facebook or Google+ or Twitter or Pinterest!!
July 1, 2016 19 Comments
Disney World Crowds: Christmas 2016 and New Year’s 2016/2017
DISNEY WORLD CROWDS FROM LATER DECEMBER 2016 TO EARLY JANUARY 2017
This is for a pretty basic reason: kids are out of school then.
However, not every school district has the same break schedule.
In 2016, as always, there’s more kids out the week between Christmas and New Year’s week than before or after, but there’s still plenty enough on break before Christmas week to wildly crowd the parks. The week after New Years in 2017 has many more kids on break than usual, so I expect it to be crowded too, especially the first part of the week.
SCHOOL BREAKS AND DISNEY WORLD CROWDS
Most years, there two typical sorts of breaks:
- Long breakers–districts that take at least 2 full weeks (and three weekends) off
- Short breakers–districts that take off as close to only December 24 to January 1 as they can
As a result, the period Christmas-New Years is always mobbed at Disney World, as everyone is out of school then, but the periods before and after vary from year to year depending on what day of the week Christmas falls.
In 2016, a Sunday Christmas put long-break districts in the position having to pick when to schedule their second week–before Christmas weekend, or after New Years. Enough put it before Christmas that I expect to see heavy crowds that week, even with a lot of kids shifted to the first week of January
But their’s still a ton of kids in districts that picked the first week of January for the second week of their break. As a result, in my 2017 Disney World crowd calendar I am shifting my former forecast of that week from “moderate” crowds to “high” crowds–particularly high early in the week, and better later in the week.
ACTUAL 2016-2017 CHRISTMAS SEASON SCHOOL BREAKS
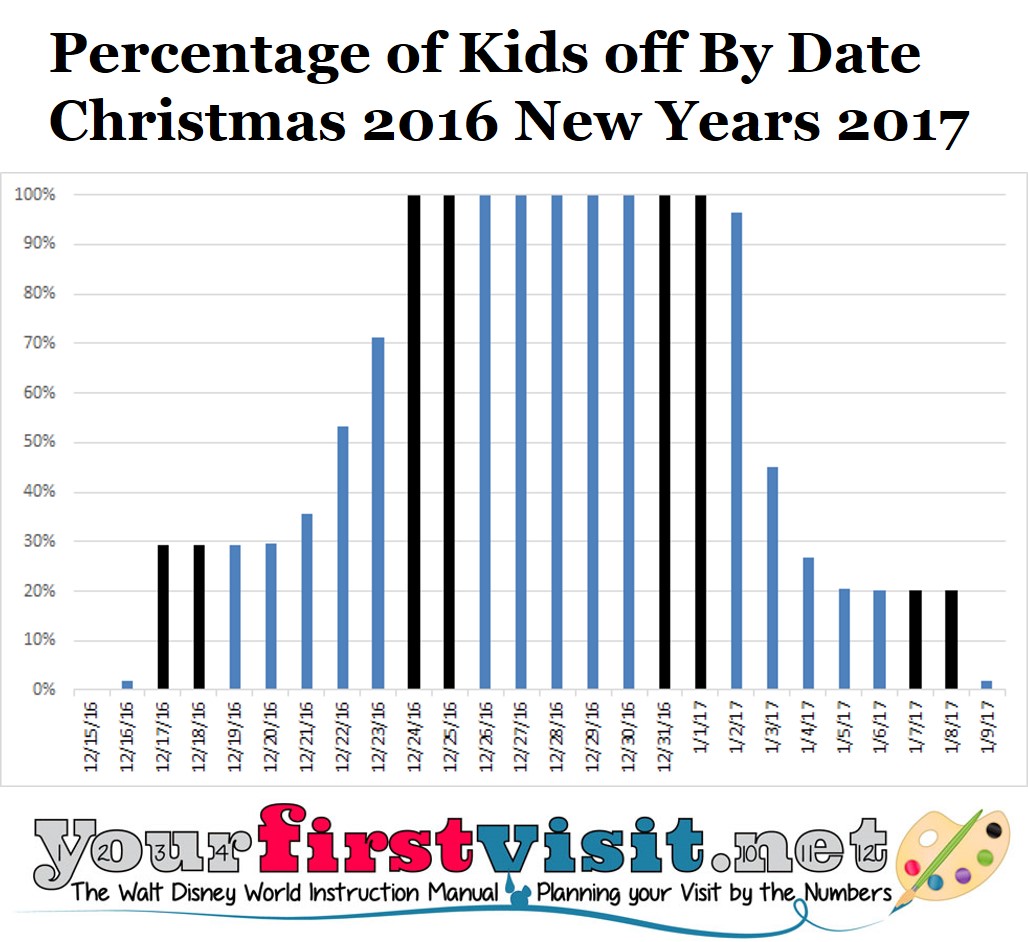
The chart above illuminates this.
It’s based on data from a weighted sample including almost 280 of the largest relevant US public school districts with almost a third of total US school kids included.
(For how the database is built, see this.)
The weekends are in black and weekdays in blue. Click the image enlarge it.
You can see that many breaks begin Saturday the 17th, with hardly any kids on break before then. More kids go on break beginning the 21st, and by the 24th everyone is on break.
Pretty much everybody stays out of school through January 2, 2017, and while most go back to school right after, almost 20% of US schoolkids remain on break through January 8.
Follow yourfirstvisit.net on Facebook or Google+ or Twitter or Pinterest!!
June 30, 2016 6 Comments
“Fall Breaks” and Autumn 2016 Crowds at Walt Disney World
FALL BREAK CROWDS AT WALT DISNEY WORLD?
One of the things you’ll see now and then on the web is the claim that “fall breaks from school create big crowds at Walt Disney World.”
“Fall breaks” are multi-day school holidays before Thanksgiving, and, if material, would have an effect on Disney World—because Disney World is most crowded when it’s easy for kids to go.
If you check the facts, though, you’ll find that fall breaks are both uncommon and scattered across October and early November—other than Jersey Week and the weeks before and including Columbus Day.
Outside of those three weeks, you are much more likely to run into trouble in the fall by choosing to go to the Magic Kingdom or Epcot on a bad day—
- Epcot on a weekend during Food and Wine,
- The Magic Kingdom on a day when Mickey’s Not-So-Scary Halloween Party or Mickey’s Very Merry Christmas Party is not showing, and evening hours and entertainment offerings are thus more extensive.
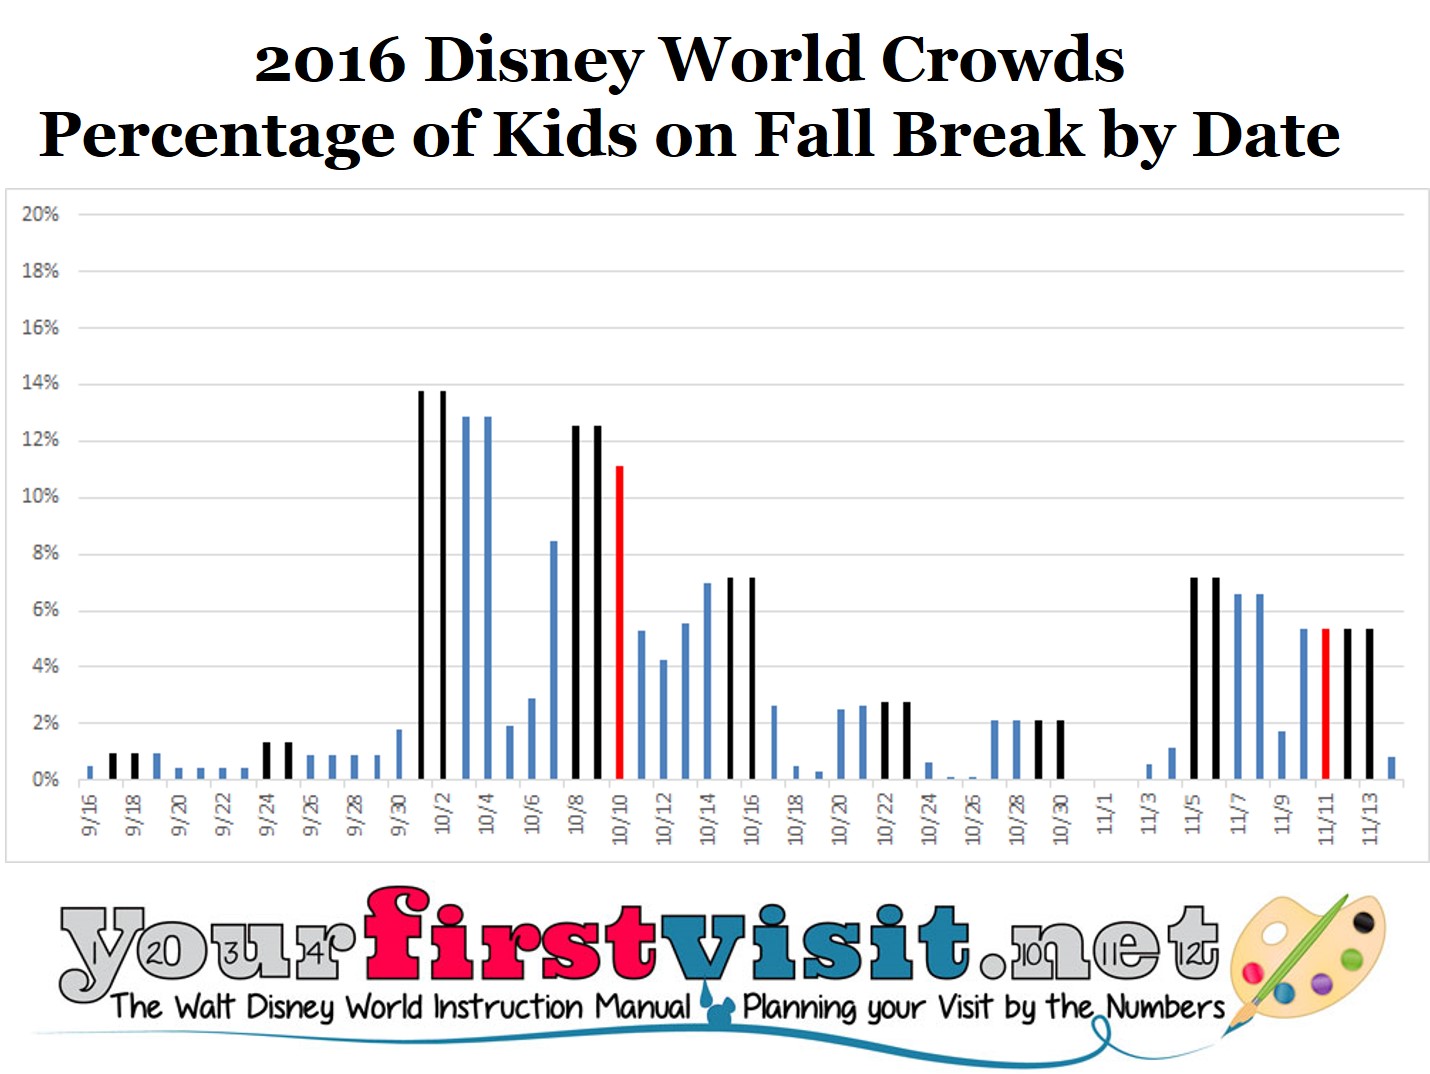
See the chart, which shows the weighted percent of US school kids in my database with more than a three-day weekend in 2016 in October and in November before Thanksgiving week. (For how it’s built out of ~280 school districts and 15.4 million kids, see the middle of this.)
In it, weekends are in black, and Columbus Day and Veteran’s Day are in red. Everything else is blue.
The first conclusion you can draw is that the only time when more than 5% of kids are having more than a three day weekend is just before and then over the week that includes Columbus Day, and Jersey Week.
These are already known to be moderate crowd weeks so as a “fall break” there’s no real news here.
Beyond those, there’s not a lot of material fall breaks. Yes, you can see them every week shown, but not much–around 2% of kids. There’s just not enough here to materially affect your choices as to when to go to Walt Disney World, other than Jersey Week and the weeks before and including Columbus Day.
Note: none of this is about Thanksgiving week, which is quite crowded and a lousy time to go!
Follow yourfirstvisit.net on Facebook or Google+ or Twitter or Pinterest!!
June 28, 2016 8 Comments
End of Summer 2016 Crowds at Walt Disney World
This site’s Disney World crowd calendars always show crowds dropping off in later August.
For example, in 2016, crowd rankings go from 8/high-minus at the beginning of August down to 2/lower in early September.
This page both explain how that comes about and also reviews how the site’s crowd calendars are built.
END OF SUMMER 2016 CROWDS AT WALT DISNEY WORLD
The highest-crowd periods at Walt Disney World all have one thing in common: they are convenient times for parents to take their kids to Orlando. That is, they are times that kids are out of school and that parents traditionally can take off of work.
What’s not so clear until you do the numbers is that actual school vacation dates are much more varied than you’d think. And there’s no good source you can go to that explains what all these varied dates are.
So usually every year about this time one of my nieces goes to more hundreds of school district websites and captures all the key vacation dates for the upcoming academic year. This year all of my nieces are distracted by babies, so I did this data collection myself.
(This time of year because you’d be surprised many districts don’t put their calendars up for the upcoming year until June, even late June–looking at you, Michigan.)
This year I collected data on 279 school districts with 15.4 million kids–about a third of the US school-age population. These include the 100 largest school districts in the U.S., plus almost 180 more of the next largest school districts mostly in the more highly-populated states east of the Mississippi–that is, the states from which in particular Walt Disney World draws its visitors.
I then create a database that shows based on district enrollment every kid who is off on every date, and weight each district them based on that district’s state’s proportion of total US visits to this website (because Disney won’t tell me actual visitation by state!). See the image above for a screenshot example.
Finally, I calculate percentage of total weighted kids on break by date and use that to inform the crowd calendars.

So you can see that
- Kids don’t start going back to school in real numbers until Monday 8/8
- More than a third are back in school by 8/17
- More than half are back in school by 8/22 and
- More than 70% are back in school before Labor Day.
In 2016, pretty much all kids are back in school by the Wednesday after Labor Day.
Moreover, vacation patterns typically don’t have people returning from their vacation the night before school begins, so the effect of these back-to-school dates is offset into earlier August by around a week.
Thus, in the 2016 crowd calendar, the week of 7/30 is rated 8/high-minus crowds, the week of 8/6 7/moderate-plus crowds, the week of 8/13 6/moderate crowds and the week of 8/20 4/low crowds.
Follow yourfirstvisit.net on Facebook or Google+ or Twitter or Pinterest!!
June 28, 2016 8 Comments
How I Build My Crowd Calendars
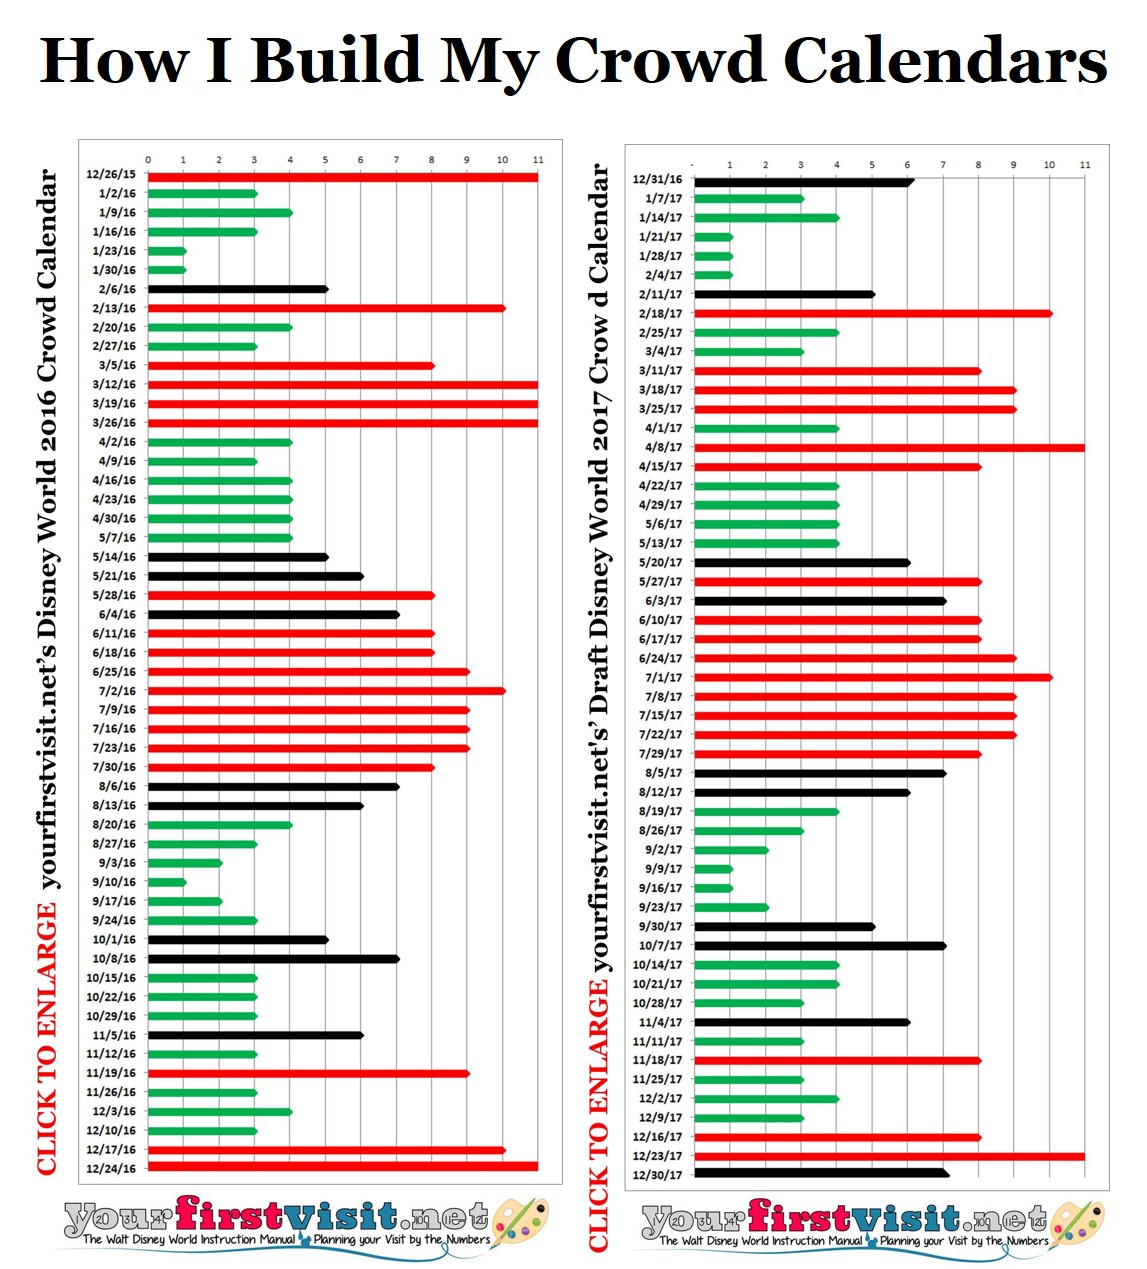
My crowd calendars (examples below) are designed to guide first time visitors to WDW who may never return toward lower crowd weeks and away from higher-crowd ones.
My ranking system—in homage to Spinal Tap—goes from 1 to 11, and the “green” weeks (rankings 1-4) are forecast as good choices, “red” (rankings 8-11) bad, and black (5-7) in between.
Because I don’t think it helps first timers to be wishy-washy, I don’t aim for a normal distribution, but rather put very few weeks in the “in-between” category. Thus my rankings end up compressed into 4 and below and 8 and above.
Other good crowd calendars that put more of their dates into the center of the ranking distribution will have many more weeks ranked 5, 6, and 7 than I do. The way I try to guide first timers to better weeks, what others will show as average—or even slightly above average—crowds I will show as “low.”
For the same reason, my rankings are ordinal, not cardinal. A ranking of 1 is better than a ranking of 2, but not twice as good.
Moreover they are not tied to the same numbers in prior years—a 3 this year is not the same as a 3 at the depth of the recession. Rather, simply, each year, within the year, I am forecasting that a 3 is better than a 5, and not as good as a 1.
My crowd calendar forecasts are based on two principal inputs:
- Disney World’s own crowd projections, as inferred from the variations in operating hours it offers over the course of the year, as modified by
- Annual analysis of every break longer than a three day weekend for 10 million US schoolkids, weighted based on their propensity to visit Disney World.
When I first started this site, my crowd forecasts were based entirely on variations in operating hours at Disney’s Hollywood Studios and Animal Kingdom parks. (I left out Epcot because it sees fewer many changes in hours, and the Magic Kingdom because I could not figure out how to account for the Halloween and Christmas parties.)
After a few years of building up data, I would forecast the next 6 months based on Disney’s actual schedule and the 6 months after that based on the historic patterns I’d developed, modified for moving holidays.
Above is an example of the results of how I used to do it.
This worked OK for a while, but was not sharp enough in distinguishing spring break weeks and the beginning and end of the Christmas/New Years rush in particular.
Moreover it broke entirely later in the last recession when Disney started showing three months of hours rather than six, and then, after it returned to six months, it started showed limited schedules for the out months, with additions to hours coming close to the actual dates.
So in response, I began supplementing my crowd calendars several years ago with annual analysis of all school breaks longer than a three day weekend in ~180 school districts. These 180 districts are the 100 largest districts in the country, supplemented by 80 more large east-of-the Mississippi districts intended to better flesh out states with only a few or no districts in the top 100.
Analytically the way I work with the districts is that I weight districts in a state by kids per analyzed district, and then weight the results for the state based on their relative proportion of visits to this site, as a proxy for geographic interest in Disney World. The state weighting corrects as well as I can for propensity to visit Disney World compared to the distribution of the 180 districts—especially the top 100—across the states.
I use the results to sharpen my forecasts for June, August, the fall, Christmas, the week of President’s Day, and spring breaks. The week of President’s Day and spring breaks are particularly tricky because of higher visitation from snow-birds than either operating hours or school calendars would imply, but with experience I’ve gotten closer on these.
That last point suggests the role of judgement. In a Bayesian sense, my draft Crowd Calendars are the prior based on history, and they then get modified based on the results of the school break analysis, my recent experience (30-60 days in the parks a year, at all different times of the year), history, judgment and help from others—particularly Josh of easyWDW and Carl of Dad’s Guide to WDW and WDW Magazine. (Josh and I co-author The easy Guide to Your First Walt Disney World Visit and within it co-create the crowd material it forecasts, and Carl and I co-author an annual crowd forecast in WDW Magazine.)
There’s no perfection in any forecasting, and I do make mistakes, especially about spring break crowds, where I get a week significantly wrong (more crowded than I predict) on average about once every two years.
Any fool can say “don’t go to Disney World in March or April” and take no risk of complaints. Instead, I try to find spring break weeks that are actually good. Rarely are my suggested spring break weeks ones that have no kids on break—rather, they are ones that are 1. before or after the March snowbird influx that 2. also have relatively few kids on break compared to the mass-break weeks in later March and before and after Easter.
There several ways these forecasts can go wrong.
First is sampling error—that the 10 million kids I analyze aren’t representative of the 40 million I don’t. This is particularly a potential issue when I use city school district calendars as the proxy for a state, and miss different breaks in its surrounding suburbs. These different breaks won’t matter if they match weeks that are already lousy, but they will matter if they match weeks where few of the 180 districts I currently analyze have breaks. I’ll be sharpening this up for 2017.
Second is a change in Disney operations. My forecasts assume that operating policies remain similar year to year. If Disney cuts staffing and per-hour capacity, waits will shoot up even on a day when an average number of people are in the parks.
Third is a differential change in propensity to travel on a given set of dates. There’s a couple of ways this could happen.
- One is a one-time effect from weather. For example a much warmer northeastern winter, or a winter with so much snow that northeastern travel shuts down, may push people from January and February into March and April, because they either don’t need the winter break as badly, or, despite how they need it, transportation shuts down.
- Fall breaks are another possible driver of changes in propensity to travel on a given set of dates. I can’t document that they are a lot more common than they were a few years ago, but what may be happening is that more people are realizing that they are a better time to go to Disney World than the traditional holiday seasons.
This raises another point. My Disney Experience and FastPass+ have made the internet an essential part of a Disney World experience, rather than an optional one. This, plus the fact that the core Disney World first-time planners (parents in their 30s) are in the “always knew about Google” generation may mean that more people may be searching for better and worse times to go, and acting on the advice they find, thus shifting the propensity to travel at certain times.
The final issue any crowd calendar faces is a mismatch of expectations and reality.
All the time I get comments along the lines of “Hey, you said last week was a low crowd week, but we waited 30 minutes Wednesday afternoon for Pirates of the Caribbean! You made a terrible forecast.”
Well, these days an afternoon standby wait of 30 minutes for Pirates is a marker of a low crowd day…
Follow yourfirstvisit.net on Facebook or Google+ or Twitter or Pinterest!!
April 19, 2016 No Comments
Disney World Crowds in 2017
2017 CROWDS AT WALT DISNEY WORLD

Dates in it are the beginning of the week, and the forecast covers the recommended Saturday-Sunday 9 day stays.
(For 2018 Disney World crowds, see this, and for 2019 crowds at Disney World, see this.) [Read more →]
October 4, 2015 185 Comments

