Implications of Disney World’s New Date-Based Ticket Pricing
By Dave Shute
Disney World’s date-based ticketing system for theme park tickets came out yesterday, for all new tickets purchased from Disney, and for all tickets once authorized resellers like The Official Ticket Center run out of inventory of the old Magic Your Way tickets.
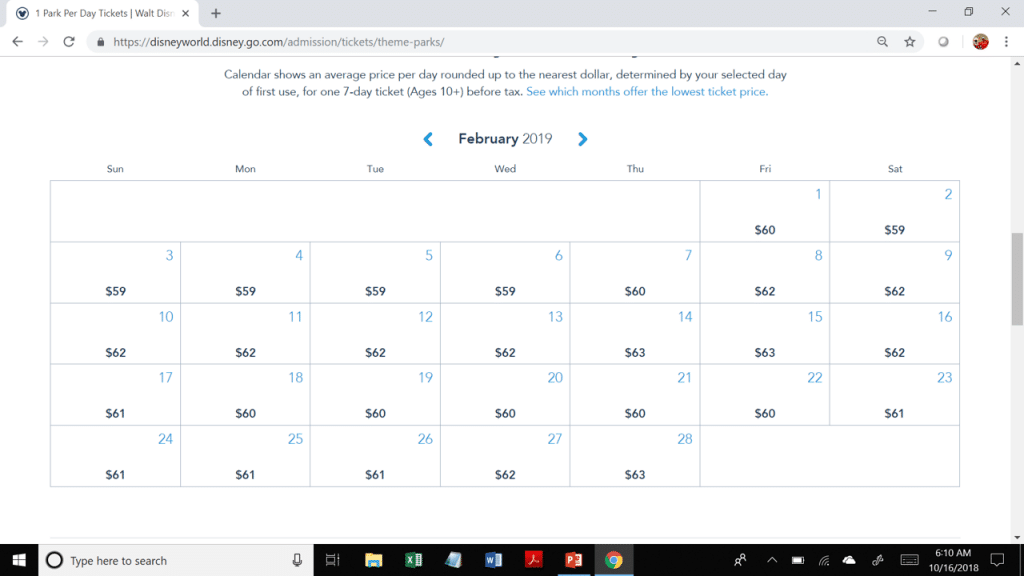
Here’s an example of the calendar for a seven day adult non-hopper ticket in February. What Disney shows is the rounded, pre-tax price for beginning the ability to use a seven day ticket on every day of the month, and every month through half of December 2019.
If you click a day (on Disney’s website, not here, you goober), you’ll see the un-rounded pre-tax price—for example, the period from February 8th through February 13th all shows a rounded number of $62, but if you click each day, you’ll actually find that the six “$62” days actually have four different prices. And don’t forget the 6.5% tax!
The effective price rises were not as devastating as some had feared, and for select dates and ticket lengths in January and February, prices actually went down a little bit. (Note that annual pass and parking prices went up as well). But my main point of curiosity was to understand how ticket prices varied over the course of the year, and how this might, or might not, change behavior—that is, when people go to Disney World.
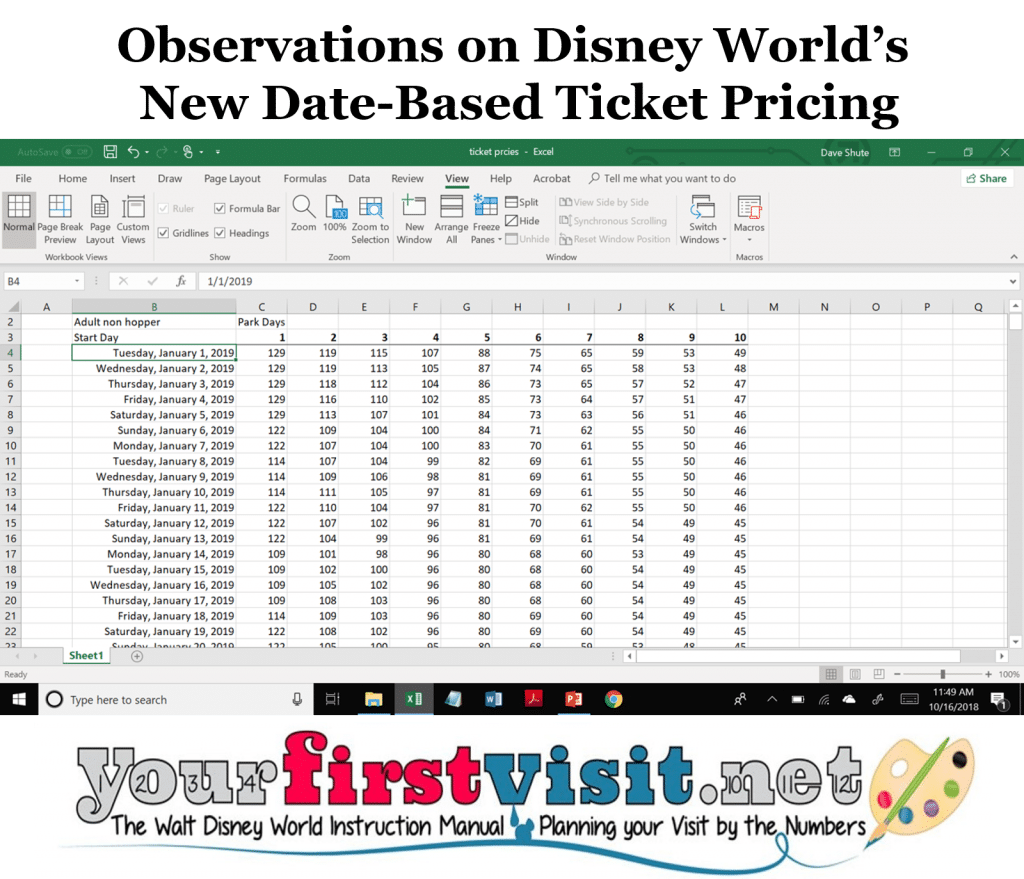
To figure this out I used the rounded, pre-tax figures that Disney posted for 2019 for those ten and older, not using a park hopper—which gave me 3,500 data points. Lucky me, I then entered them all into a spreadsheet.
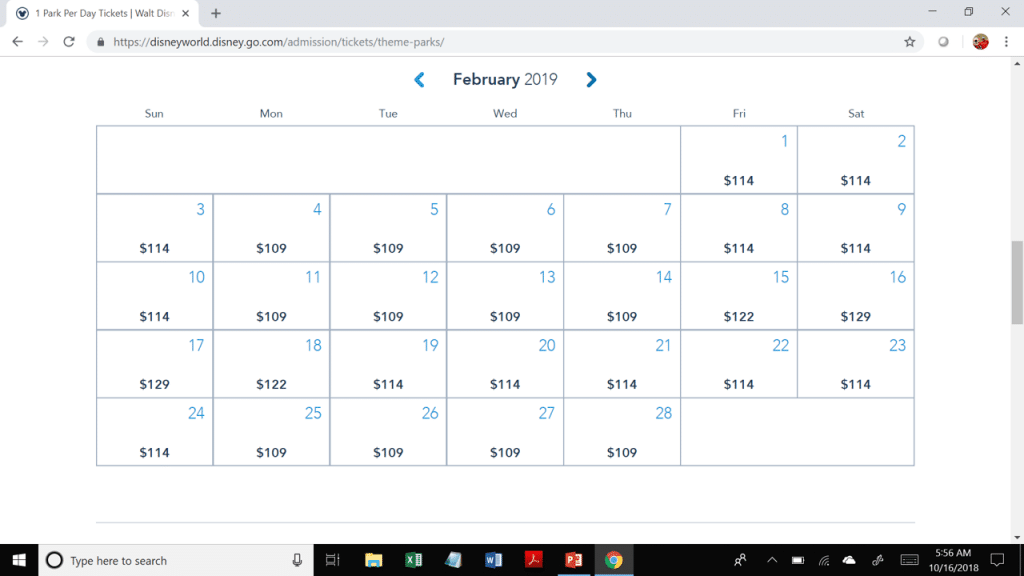
So take for example this screenshot of one day tickets for February. It’s interesting because it shows all four one day price levels (so far) for 2019—pre-tax they are $109, $114, $122, and $129.
Pay no attention to anyone who classes ticket prices into “value, regular, and peak”—they are missing a number, and moreover, I expect Disney to add a fifth one day price of over $130 as a “holiday” price for later December 2019. (The prices that came out today only went through December 16th—and no, that has nothing to do with the opening date of Galaxy’s Edge. Disney learned with Epcot not to set an opening date 15 months in advance…The famous line from Tishman about the too-early announced October 1, 1982 opening date of Epcot was “It’s not the October 1 I have a problem with. It’s the 1982.”)
The average daily prices of longer tickets are related to the average pricing of the one day tickets available for the eligible periods the longer tickets encompass. It’s a little complicated, as while a one day ticket must be used exactly on the day selected, two and three day tickets have two additional days they can be used; tickets with four through seven days of park admission have three extra days, and tickets with eight to ten days have four extra days.
So for example a ten day ticket must be used by fourteen days after the start date you pick.
(Note that if you book your tickets as Park Hopper and More tickets, you get one more day, and if you book them as part of a Disney World package, your tickets will be valid for whichever is longer–these defaults, or the length of your hotel booking.)
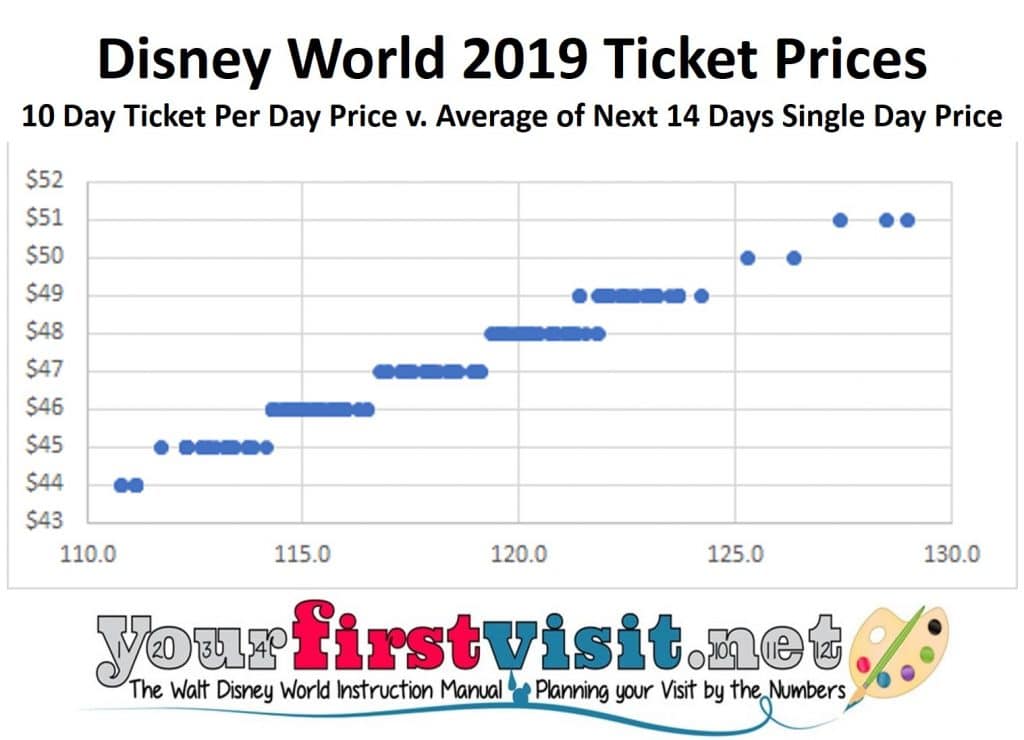
As you can see, in general there are some pretty tight correlations between them, except for some tickets at the $49 level that overlap with $48 tickets—this comes from the anomalous pricing of June 30 one day tickets, which I can’t (yet) explain.
So anyhow I loaded all this stuff into a spreadsheet, and did some analysis of ticket prices by date.
- The first takeaway is that there’s not a wild difference between the lowest and highest price over the course of 2019, for any ticket type. No ticket length’s highest rounded price is more than 9.5% higher than its average price; no ticket length’s lowest price is less than 7.8% of its average price. Differences in hotel seasonal pricing levels dwarf these date-based ticket pricing effects.
- The second takeaway is how consistent these lower and upper percentages are across all ticket day lengths—I won’t publish these numbers as the errors created from my using rounded daily prices will dwarf their specifics, but the maximums and minimums as a percentage of average was very close across all ticket lengths.
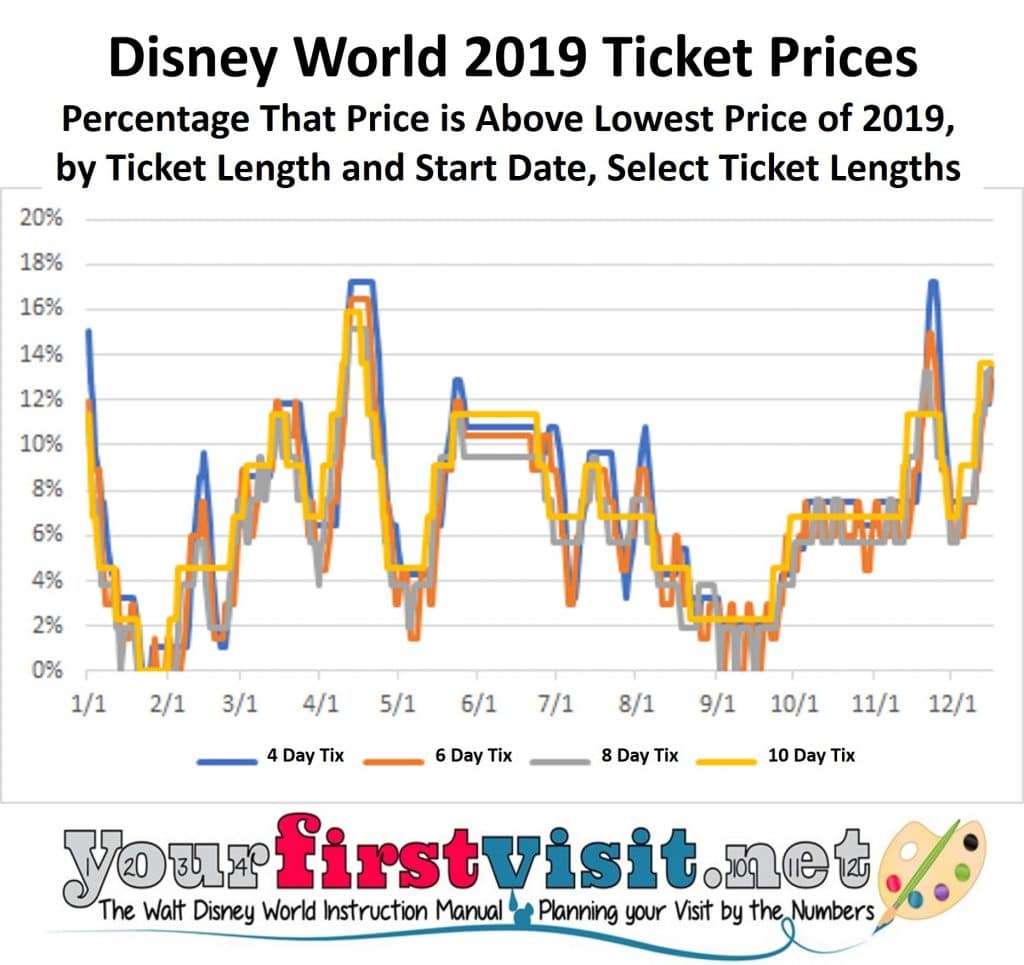
- The third takeaway is how well the ticket “price seasons” track to what you’d expect—at least when you get into the longer-length tickets. This can only be illustrated graphically.
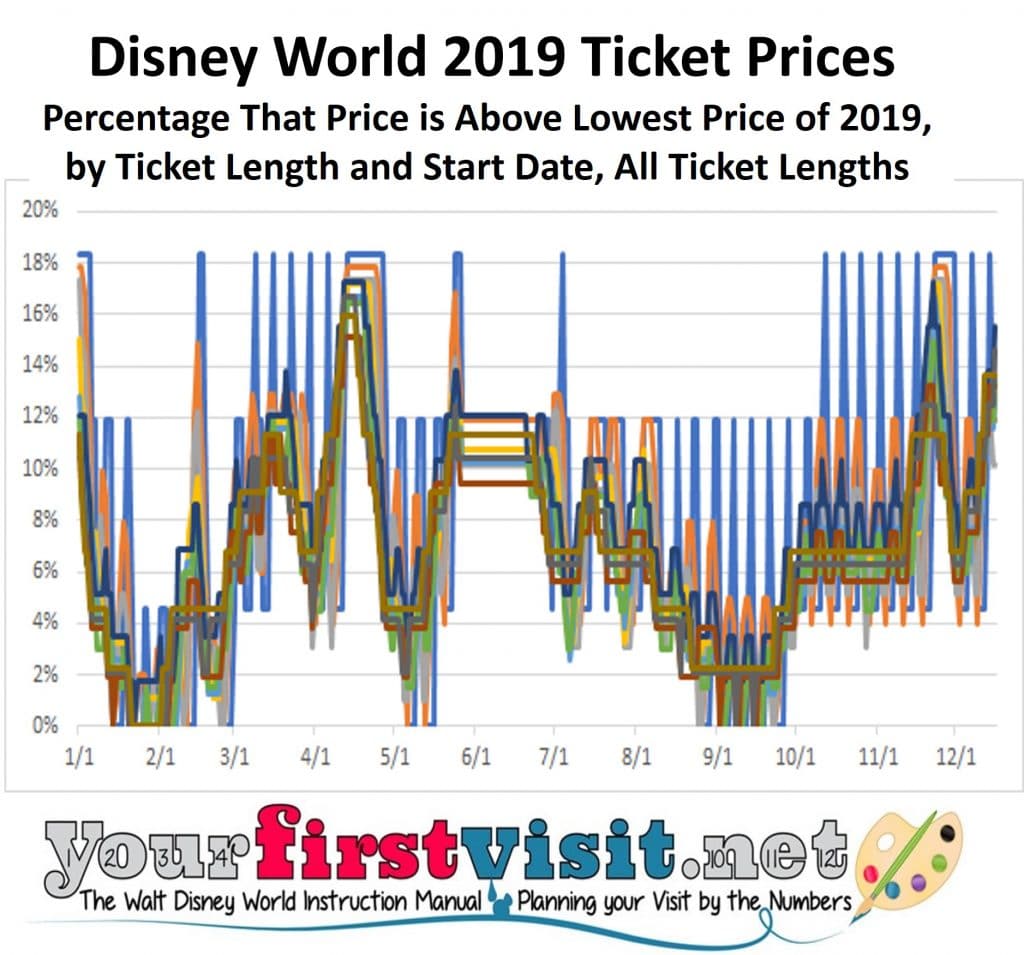
Each colored line represents a different ticket length—so in this one, for example, the blue line that flies all over the damn place because of in particular weekend upcharges is the one day ticket price by date, and the well-behaved dark gold line is the more sedate 10 day ticket price by date. The ten day line is more sedate because, as discussed above, since it is affected by the one day prices of the 14 days beginning its first day of possible use, it averages out all “normal” weekend effects (as does any ticket whose use period is a multiple of seven days—we’ll come back to that).
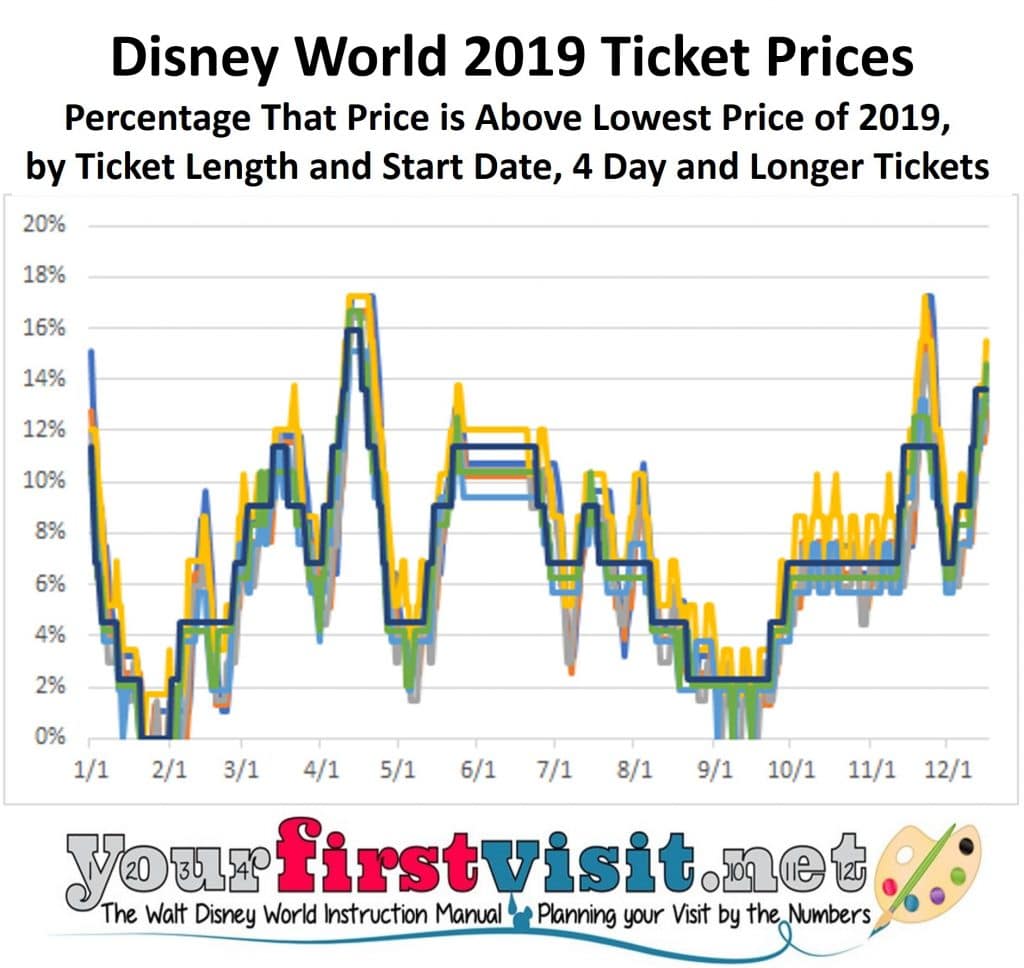
But my favorite analytic tool is this chart, which shows four day, six day, eight day, and ten day tickets. I like this especially because it has two well-behaved lines—the 10 day line, as noted above, and the four day line (four day tickets get three extra days to use them, so the four day ticket with its seven day use period line also averages out normal weekend effects). The six and eight day lines add some gritty reality, and make the chart more broadly usable to my readers. This is the chart I expect travel agents to blow up and tape on their walls.
You can see pretty clearly in this chart the seasonal pricing over the course of the year, and it all makes immediate intuitive sense except July and perhaps late October-early November.
In January you see prices collapse from the 2018/2019 holiday season peaks (the holiday season in early 2019 extends to January 6th). Prices then ramp up for the period around President’s Day—long weekends begin on the Thursday before President’s Day, and many northeast school districts have the whole week of President Day off, and come to Disney World then—then slip back down until we see the first spring break peaks in later March.
Prices then go down again, and then, because of the late Easter in 2019, see a second spring break peak in later April. They roll back down in early May, but then build over the course of the month as they include Memorial Day weekend and summer rates.
The new Disney World tickets prices bump around more in the summer than I would have guessed. June 30, as I noted above, is an anomaly that affects the prices of tickets whose eligible dates include it. Perhaps Magic Kingdom is closing at 4p on June 30 for a blogger-only party that date? One day prices go up for the 4th of July, then down again on July 7, then up again on July 15—perhaps tying to South American winter breaks. Note that the effect on longer-length tickets of these changes begins before the actual date of the price increase, as its effects are averaged into the longer ticket.
Prices then go down over the course of August until they hit their second-lowest levels of the year late in the month, a pricing level that continues into late September. Prices then stairstep their way up into higher levels by the Columbus Day weekend, and stay largely at that level until we start seeing the effects of the Thanksgiving upcharges, which dominate later November, and, if you are pursuing a long ticket, start kicking in as soon November 12.
I would have expected to have seen more of a drop in late October and early November. If you look closely you can see such a drop in the shorter tickets, but it gets averaged away in the longer ones.
As you would expect, prices then drop in the lower-demand days just after Thanksgiving and in early December. Prices stop after December 16, but I would expect daily prices for later December 2019 to be on the order of $135—that is, about 5% more than December 2018.
The fact that your ticket price for longer tickets in particular will be influenced by an extra three or four days of eligibility for use will create some interesting questions for those booking their visit to end just before a price increase.
So for example, if you are buying a seven day ticket for a pre-President’s Day visit February 9th through the 15th, you could set your first eligible day as February 9th, pay $62/day, and be done with it. But you can visit the parks February 9th through the 15th with a ticket that has its first eligible day as February 6th, and pay just $59 a day—not a huge difference, but worth noting.
Another observation before I get to my big one is that “cost to add a day” has become complicated. Until now, the cost to add a day was straightforward—it cost for example $10 (pre tax, for consistency) to add an eighth day to a seven day ticket any time of the year.
Now, the cost of the eighth day is affected by the variable one day price not just of that eighth day but also of one more day, as seven to eight days is the break point for between three and four extra days to use your tickets. Depending on when in the year you add it, adding an eighth day will cost anywhere from next to nothing to $27.
On average over the year, adding a second day to a one day ticket costs about $100, adding a third day to a two day ticket $96, a fourth day $84, a fifth day $17, and a sixth through tenth days $10-$12 each. This average roughly follows the patterns of prior years. But date-based effects mean that your actual mileage to add a day will vary, A LOT.
Back to the beginning—my main curiosity on the new Disney World date based pricing was whether the differences between lower cost and higher cost vacations would be enough to drive people in big numbers out of lower-crowd days and into higher-crowd days.
But with variations of just +/- ~10% around average prices in 2019, and, as you can see on the charts, most dates seeing ticket prices between in the narrow range of 3% to 11% higher than the lowest of the year (for example, ~76% of the released prices for five day tickets in 2019 are between 3 and 11% higher than the lowest of the year, with about 12% of dates either above or below those levels), I just don’t see enough energy in these prices to have much effect on park date choices.
Yes, I do think more people will choose less expensive dates, and avoid more expensive ones, than when ticket prices did not vary by date, but not enough to profoundly shift the crowd patterning that we’ve seen over the past few years.
At least for 2019, and at least as long as the current set of prices remains in place, I see them as having more the effect of increasing Disney’s monetization of highly-demanded periods than materially shifting crowds away from them.
That said, Disney can change prices and offer 3,500 more data points for me to play with at any time, and likely will once it has better visibility into the opening date of Galaxy’s Edge, or simply has one of its moods.
With all the focus on the late 2019 open of Galaxy’s Edge, we sometimes forget that 2020 will be the year of Star Wars. I see 2019 date based pricing as a way to test the effect of +/- 10% price changes on crowds, and for Disney to use its learning from that to figure out how to use 2020 prices to really push people into lower crowd times, so that Star Wars waits don’t exceed 24 hours… Expect to see much sharper price differences in 2020.
All the data is in a spreadsheet that you can download by clicking the link. And the long-time travel agent partner of this site, Kelly, can help you book–or avoid–any date! Contact her using the form below!

Follow yourfirstvisit.net on Facebook or Twitter or Pinterest!!



9 comments
Thanks for all the hard work you put into this Dave!!
Wow. Just… wow.
And how exactly are places like The Official Ticket Center going to sell tickets with this kind of system in place? Can they?
BostonEd, I’m pretty sure they will all still be in business, but it will be more complicated for them.
Cracked me up right off the bat!! “not here you goober!”..very funny. In reference to the Ten day (non hopper if it matters) tickets, you indicate that they would expire 14 days from selected ‘start’ date, or the length of your stay on property. I believe that the longest package available to USA guests is 14 days..do you anticipate that will change ? allowing a longer stay and hence extending the ticket expiration dates? This was a tough read, but you made it funny, I can ‘feel’ the work you put into this and I appreciate your time and accuracy!
Dawn, my guess is no. The differences are tuned especially to folk who might have for example a three day ticket and an eight night stay, and less so for the ten/fourteeners. The initial word is that split-stays don’t count (that is, you don’t get extra ticket days if you check out of the Poly and check in to Art of ANimation) which seems dumb to me. I hope that changes.
Lots of hard work here.
Thank you.
You are amazing!
The thing about this change that really hoses me is all tickets are no longer good for 14 days.
I tend to stay longer than average, usually 11-12 nights, but only buy theme park tickets for 3 or 4 days. Spending tons of extra time wandering the resorts, at the H20 parks, at the pool, or my balcony. I spread these park visits out over the entire stay. Now, with the limited days they can be used, I’m gonna have to make a change or pay more.
Which sucks because I pretty much always visit in September, which is one of the few time periods where the price dropped.
Jeff-especially because the ticket windows don’t seem to expand to cover split stays…If you stay 12 days at one resort, the ticket valid use window expands to fill that time–but not, it seems, on split stays…
We are military retirees planning on taking our son (current military) and his family late Oct/Early November. We had planned on buying the military tickets on base. How does this system affect us?
Caroline, if you are buying Armed Forces Salute tix, it will not matter. Prices for those are fixed. See this: http://www.militarydisneytips.com/Disney-Armed-Forces-Salute.html#themepark
Leave a Comment | Ask a Question | Note a Problem