
Updated Disney World 2019 Price Seasons
By Dave Shute
Yesterday I published my updated material on Walt Disney World resort prices in 2019, based on my sampling (and analysis) of more than 3,200 individual hotel/date/price combinations.
The purpose of this site is to help people make better choices in their Disney World vacations, either from direct advice or from providing the facts and letting people make their own decision from them.
Disney resort hotel prices matter because the exact same room can cost 75% more depending on what nights you stay in it.
To help guide people around this without getting into the more than 30,000 individual pieces of data, my 2019 Disney World price seasons material first is a sample of half of Disney World’s hotels, and second analyzes and depicts only the least expensive room types within them.
I then show the results in two ways: charts that smooth out the changing prices by averaging prices over a seven night stay, and “invented” (I’ll return to this in a minute) “price seasons” that give a broad sense of how expensive a room is during different parts of the year. In my “seasons” I always express prices as how much higher they are than the lowest prices for that room that year.
In this post I want to explain a little about why I do it this way—and where the seasons came from. But if you don’t care and just want to see the results, go here; if you want to see every single data point, go to MouseSavers.com here.
NIGHTLY ROOM RATES
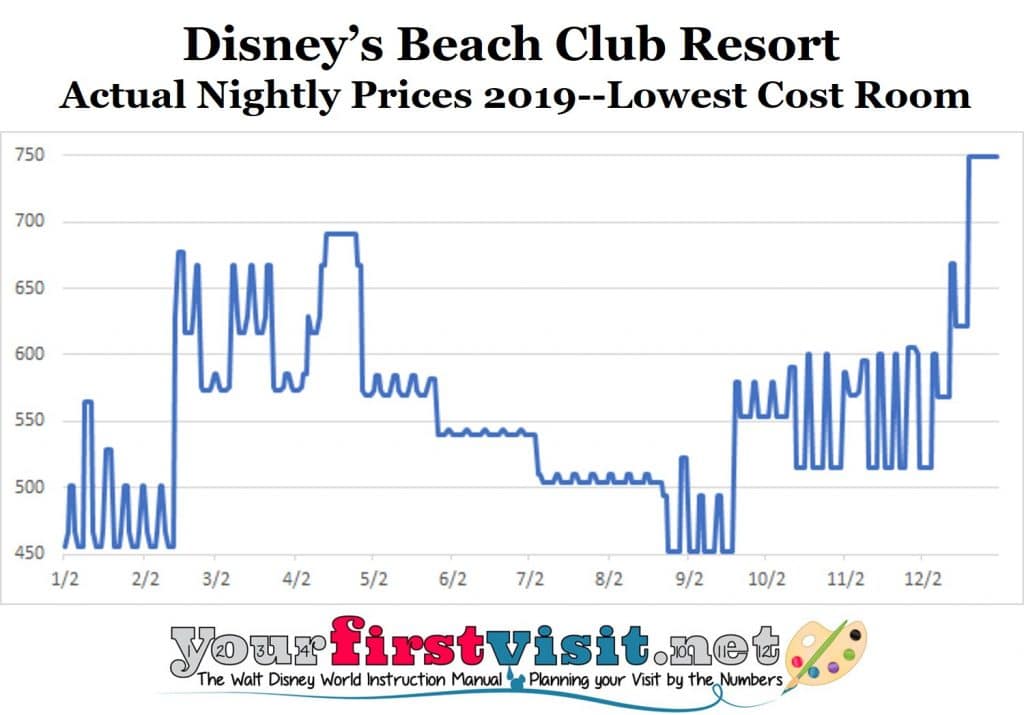 Here’s a chart of the actual rates by night in 2019 of a standard view rooms at Disney’s Beach Club resort. Note that I have truncated the lower axis at $450/night to make the patterns more readable.
While you’ll note some consistency over periods (this is where “price seasons” comes in), there’s a lot of wiggles in the line. This comes from all the different prices during the week that Disney now charges, as well as various holiday weekend upcharges.
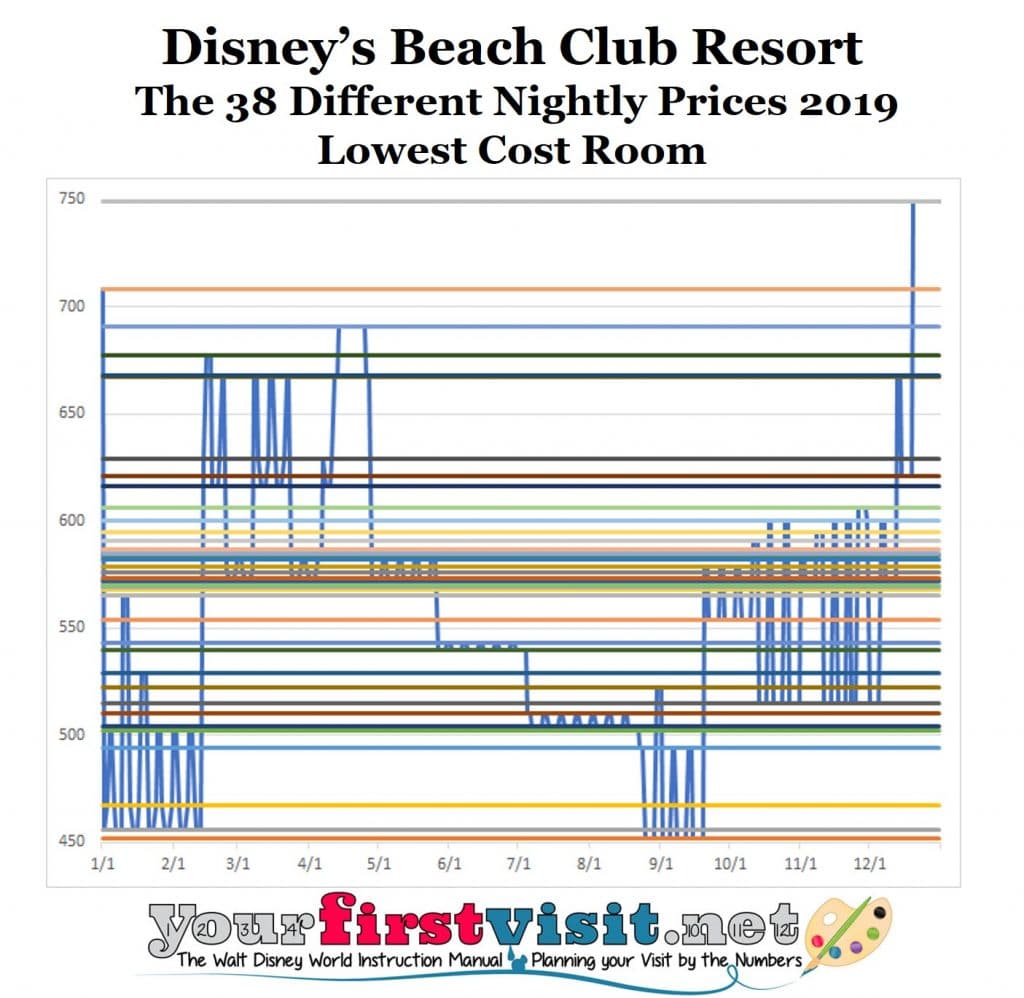
The net is 38 different prices for the same room over the course of 2019. In this chart, I have a straight line across for each of the 38 prices:
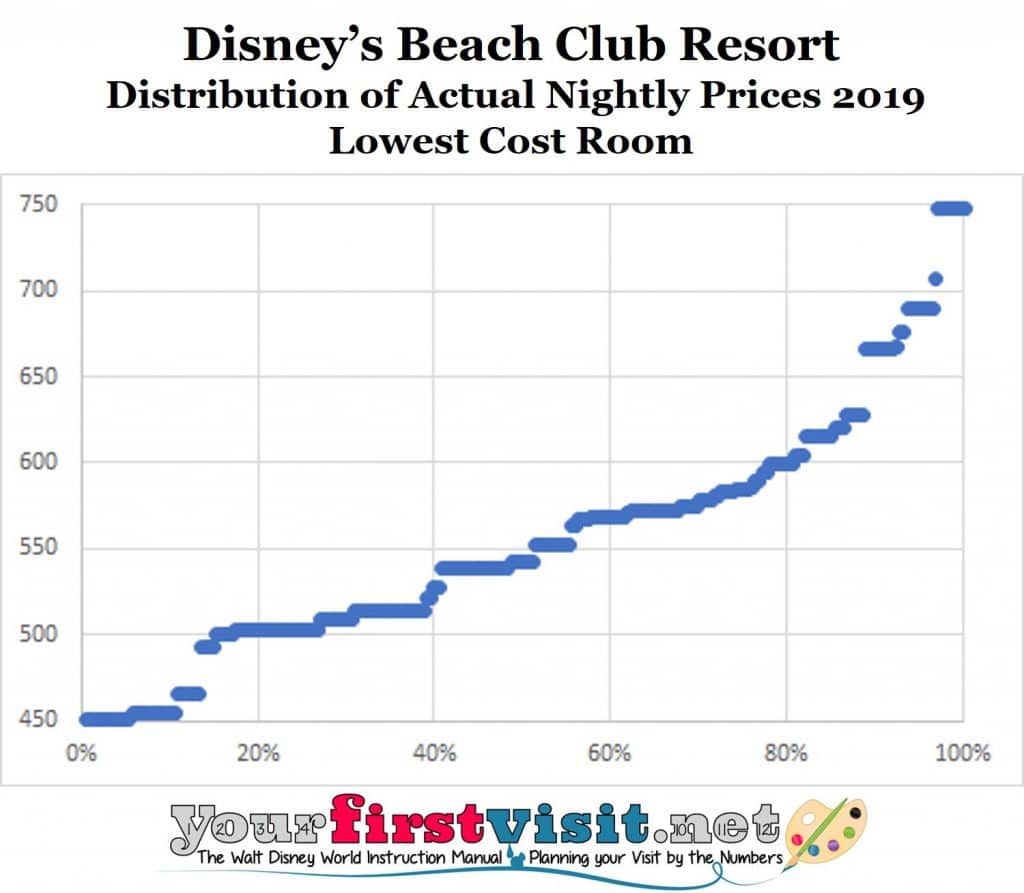
 …and in the chart below, I show the distribution of prices for this room. More than half of the nights of the year, you can get this room for $550 or less, but 20% of the nights of the year you will pay prices of $600 or much more (all my prices include tax).
 To make these price shifts a little easier to understand, I smooth them out. My smoothing approach is to average prices over seven nights—the check in night, and six more. This is what I display on my 2019 Disney World price seasons page. I pick seven nights to map to the set of prices that vary over the week but are the same the next week characteristic of many Disney World price seasons.
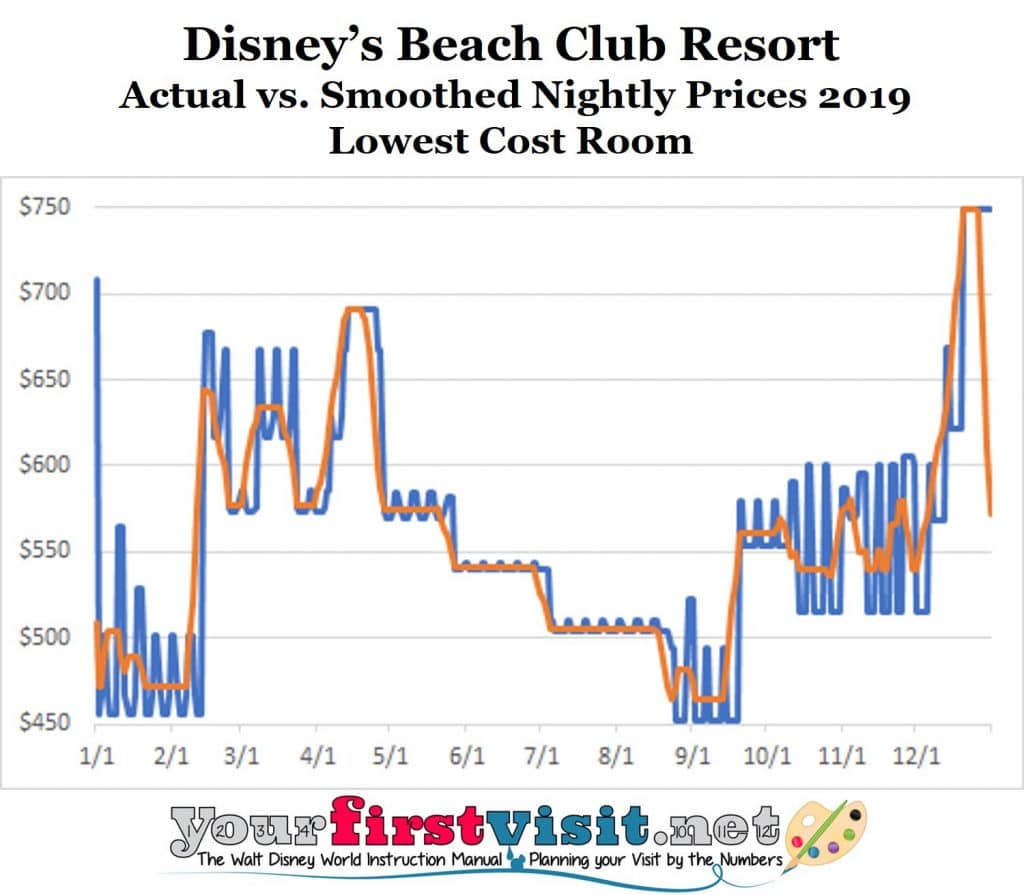 This chart shows the smoothed line (in orange) on top of the actual prices in blue. I believe that this type of smoothing makes it much easier to interpret what prices you will run into for any check in date.
DISNEY WORLD PRICE SEASONS
Disney World used to group and label periods of the year into resort “price seasons.” The traditional price season calendar would have a day or two of peak season in early January coming out of the holidays, then shift into value season, then peak again for Presidents Day week, then regular season, then a mix of regular and peak during spring break before Easter, then Easter season, in years with an early Easter some more peak seasons, then regular season, then summer season, etc.
Last year, Disney stopped labeling the parts of the year into price seasons, and added more distinct price points over the course of the year. For 2019 it continued to abandon the “season” labeling concept, and added even more distinct prices. (I’ll publish more on 2018 vs. 2019 resort prices later this summer.)
But you can still see price seasons, if you look closely enough.
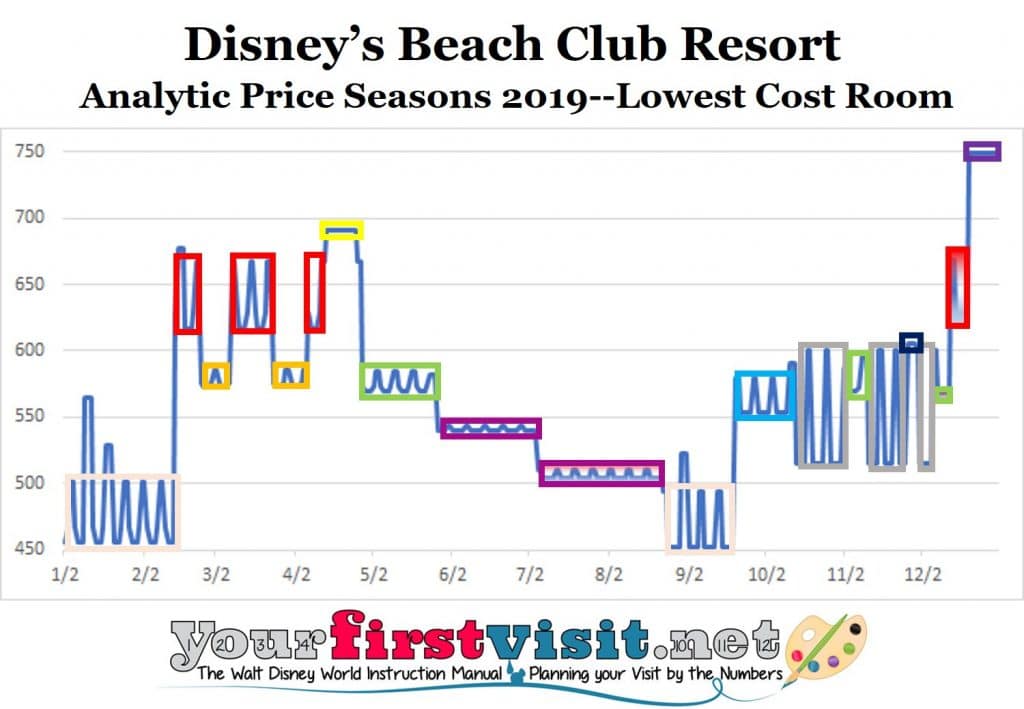 See the chart, where I have used colored boxes to group prices into seasons (ignoring holiday weekend upcharges), keeping the same color when the numbers remain the same. I have then labeled these with the traditional names—although my labels don’t always correspond to those used by MouseSavers.com.
The first box in January, in light orange, is the value season. Then we have a sequence of peak (red) and regular (orange), culminating in the Easter season in yellow. A distinct season then opens, which I call regular 2. After that are two distinct summer seasons, then the value season reappears in late August and early September.
Things then get a little confusing, but based on both this and the same charts for other deluxes, I basically see a sequence of regular variants (in blue and green) that I call regular 3, regular 4, and regular 5, alternating with the Fall season (grey) in between, interrupted by the Thanksgiving upcharge in black. Later in December peak season returns, and then we skyrocket off into the holiday seasons.
This then is the set of seasonal labels I use in my text descriptions of the 2019 Disney World resort price seasons.
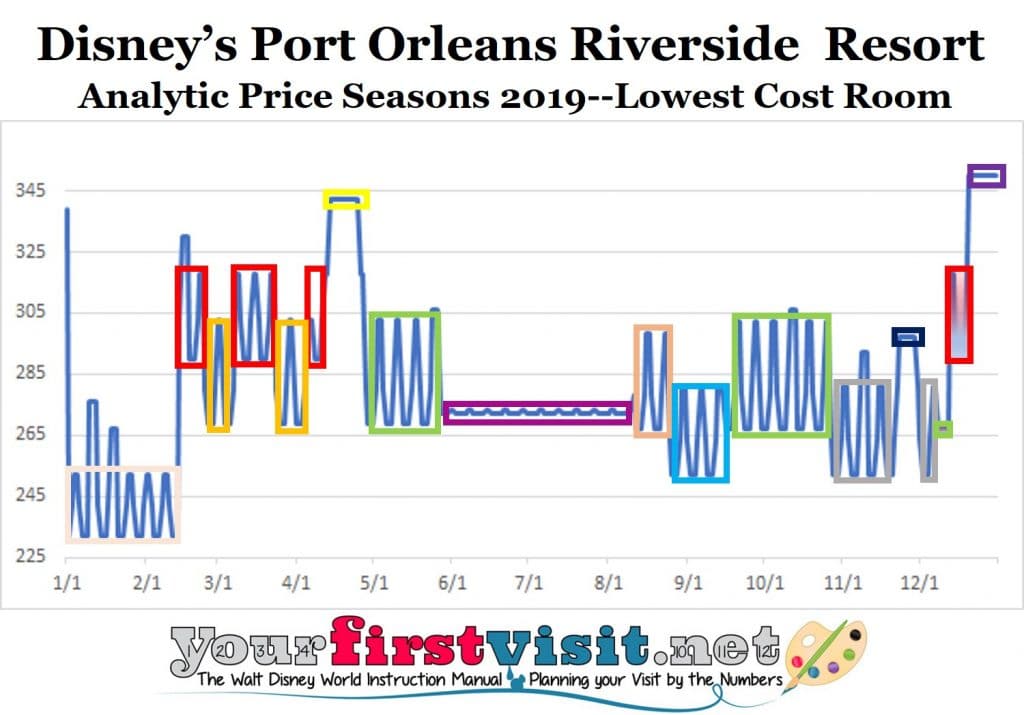
The values and moderates continue to operate to a different seasonal calendar then the deluxes between July and Thanksgiving but I did the exact same graphical analysis to uncover their seasons. Here’s an example of one of the moderates:
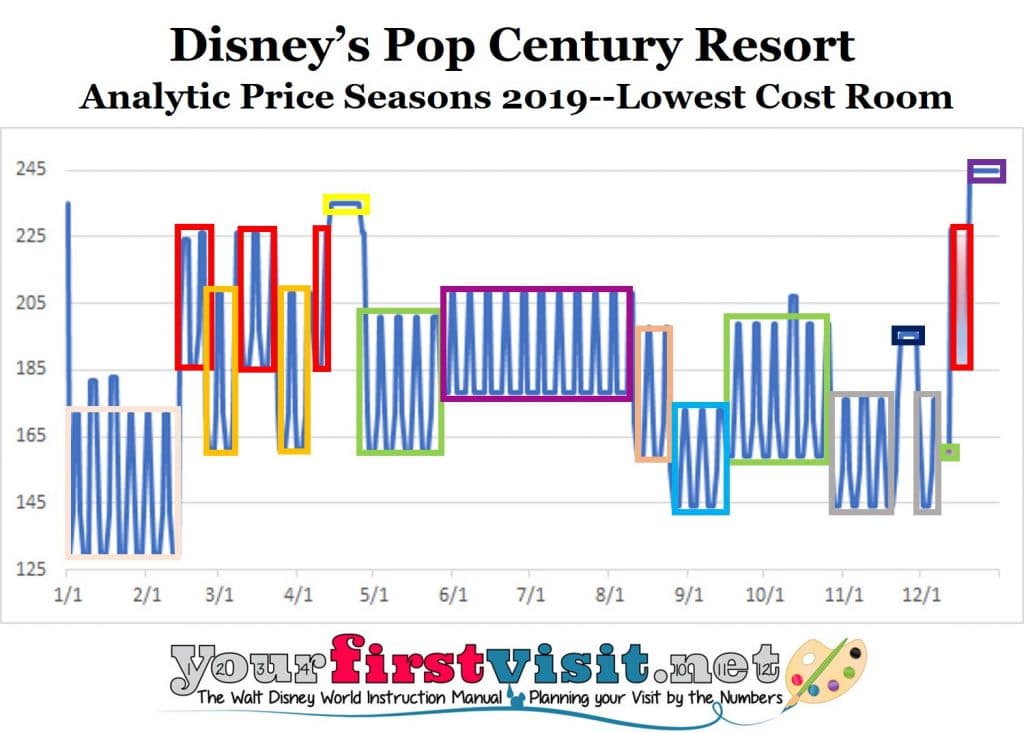
 …and of one of the values:
 If this is all too confusing, my travel agent partner Kelly can help you book during a lower-cost period. Contact her by using the form below.


Follow yourfirstvisit.net on Facebook or Twitter or Pinterest!!

0 comments
Comment by typing in the form below.
Leave a Comment | Ask a Question | Note a Problem