
Disney World raised its ticket prices on March 12 for the rest of 2019. There’s been much silliness written since about the level of the increase by folks not so good at math, ranging from “prices increased 15%-30%” to “prices increased about 5%.” (For how Disney’s new-in-October-2018 date-based ticketing concept works, see this.)
In fact, the average price increase across the ten ticket day options for adult single park per day tickets for the period April 1, 2019 through December 31, 2019 was 7.9%. But of course no one buys an average ticket, and actual price increases vary quite a bit over the course of the 9 months remaining in 2019.
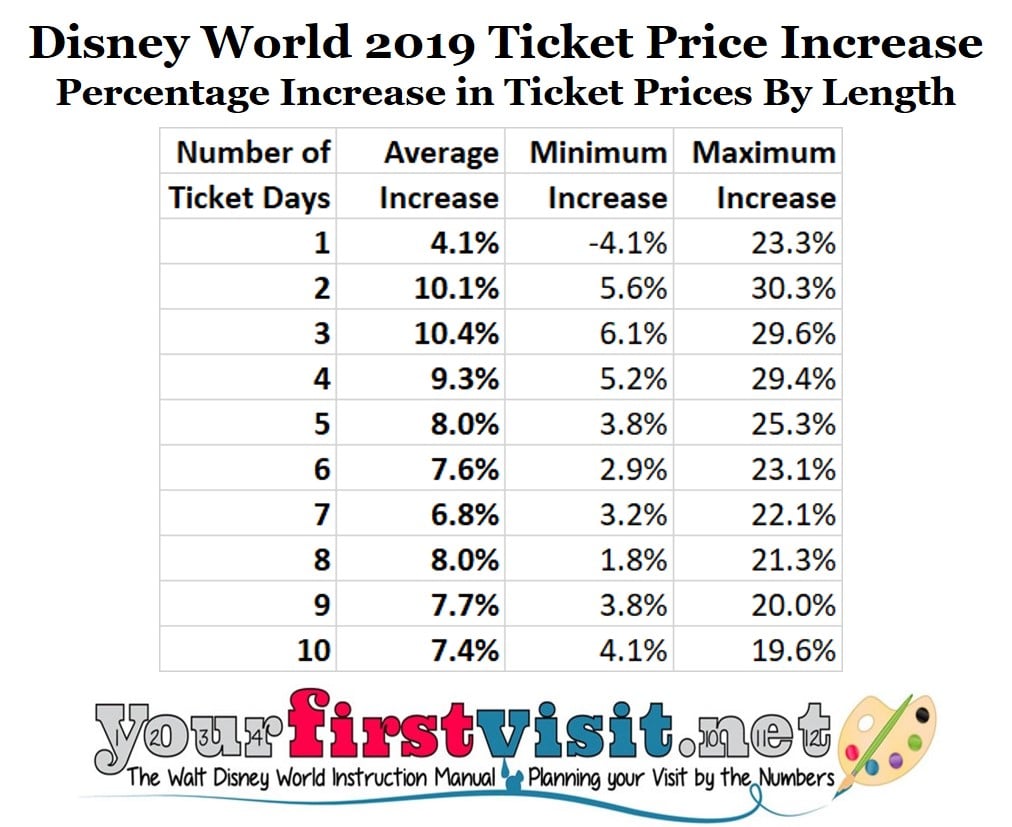
The following table shows by ticket length the average increase, minimum increase, and maximum increase for the period April 1 through December 31, 2019, compared to the prices that had already been in place for 2019.
A couple of things are worth noting. First, all lengths beyond one day had an average price increase higher than the average increase in one day tickets. This mathematically means that the discount for longer tickets, on average, is not quite so high as it had been before.
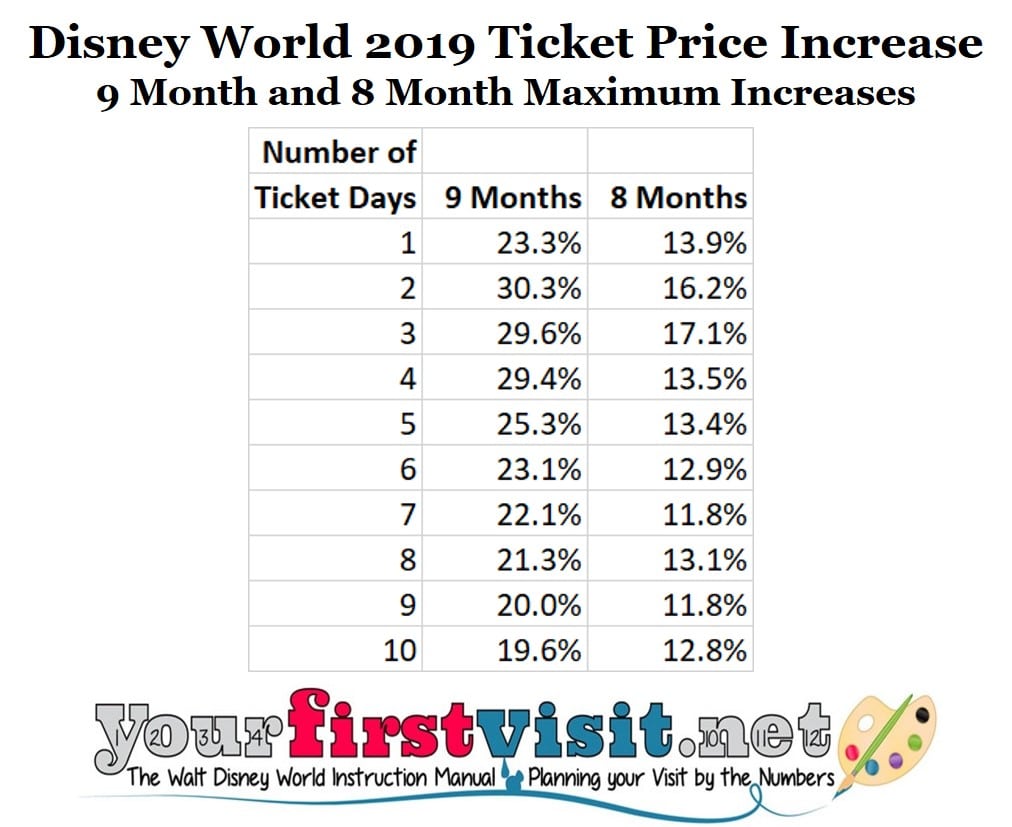
The second point worth noting is how high the maximum price increases are, ranging from 20% to 30%. A major piece of this is a big increase in the price of later December tickets, which you can see from this table, which shows maximum increases from 4/1 through 12/31 and then 4/1 through 11/30:
How prices were generally changed over the dates of the year begins to be clear in the next chart, which shows the percentage increase for every ticket length plotted against the first eligible day for that ticket.
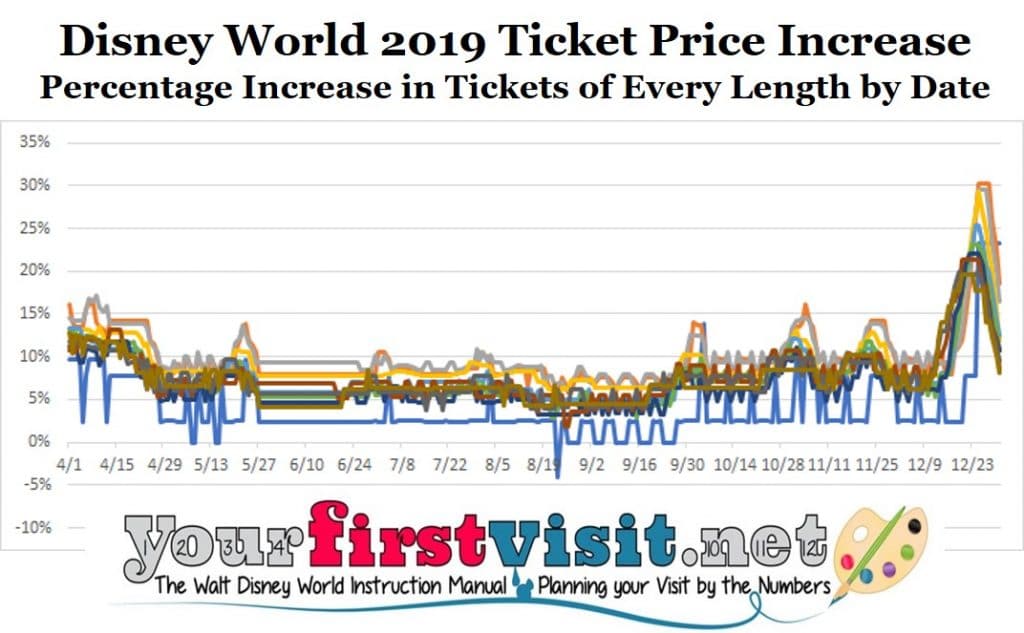
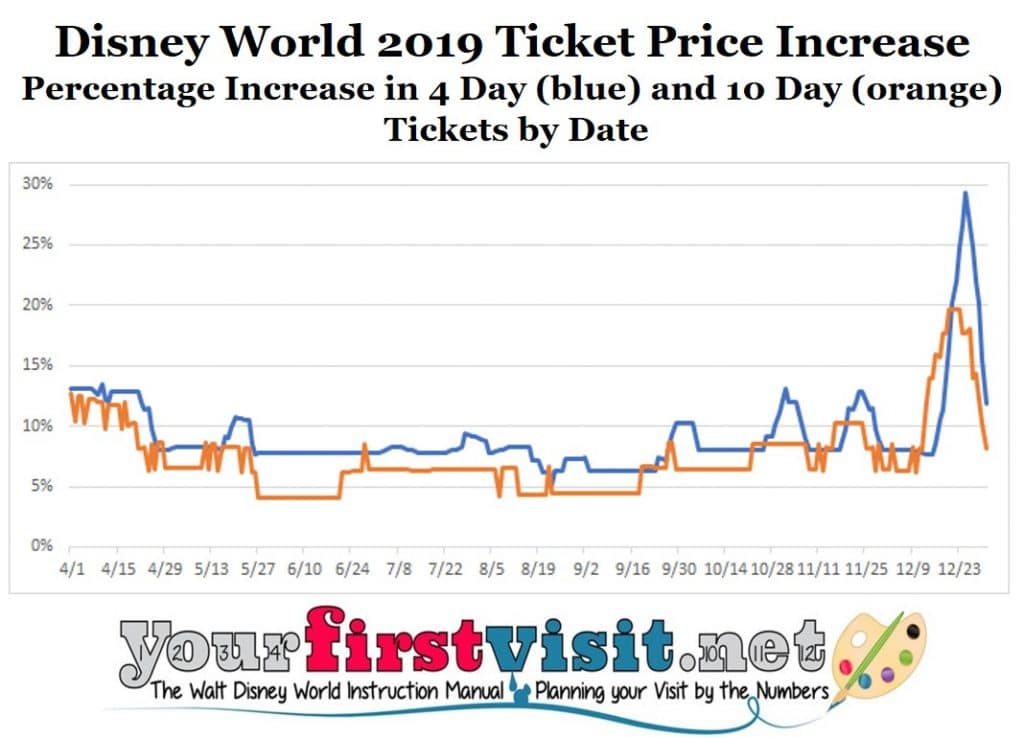
Ticket prices are up most sharply in many of the popular break and holiday periods. This general pattern does not surprise me, as the initially-released range of high to low prices for the date-based ticket pricing model was, at about an 18% spread between the least and most expensive tickets, too narrow to actually much incent changes in people’s behavior and drive them to lower-priced dates.
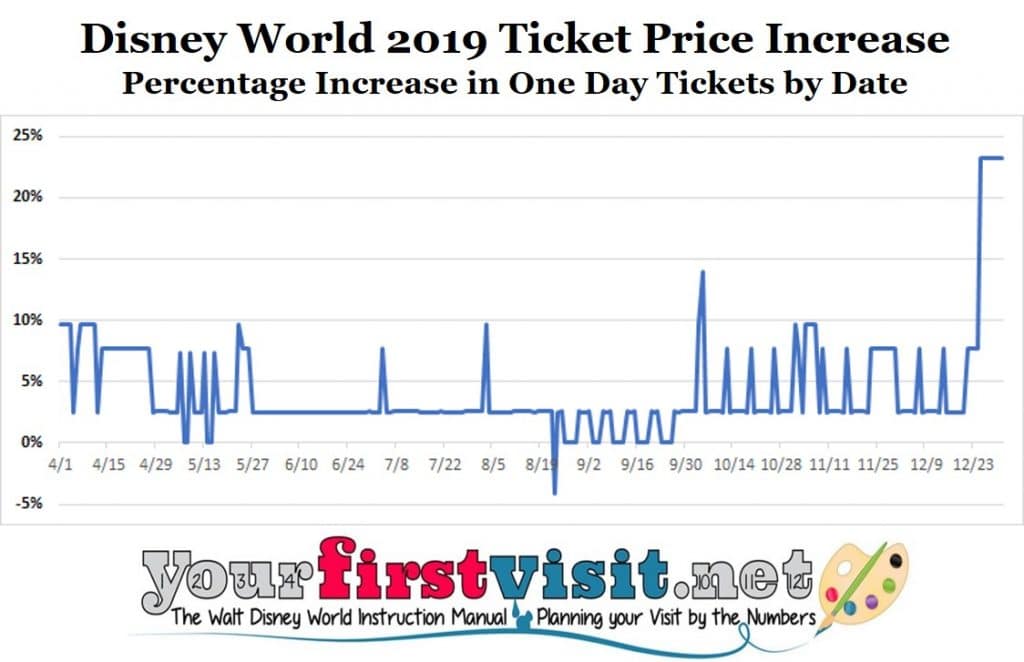
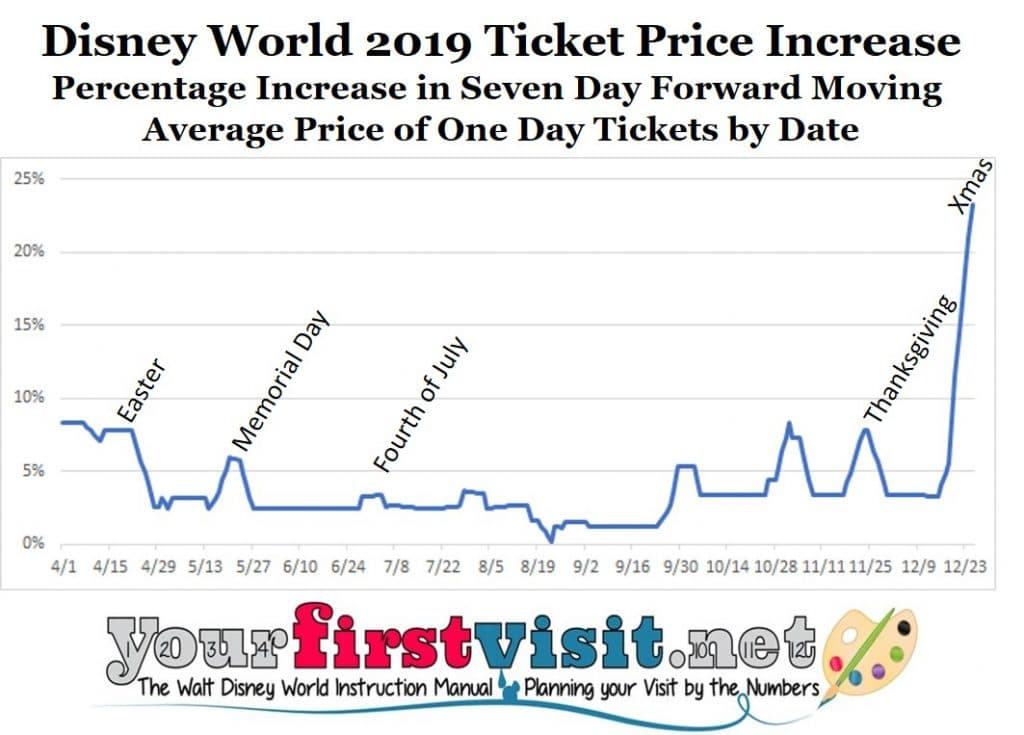
Because of differential increases over weekends—which is why the last chart saw so many saw-toothed shapes—it’s a little easier to see what’s happening in one day tickets if you use a seven day moving average (a forward moving average in this case):
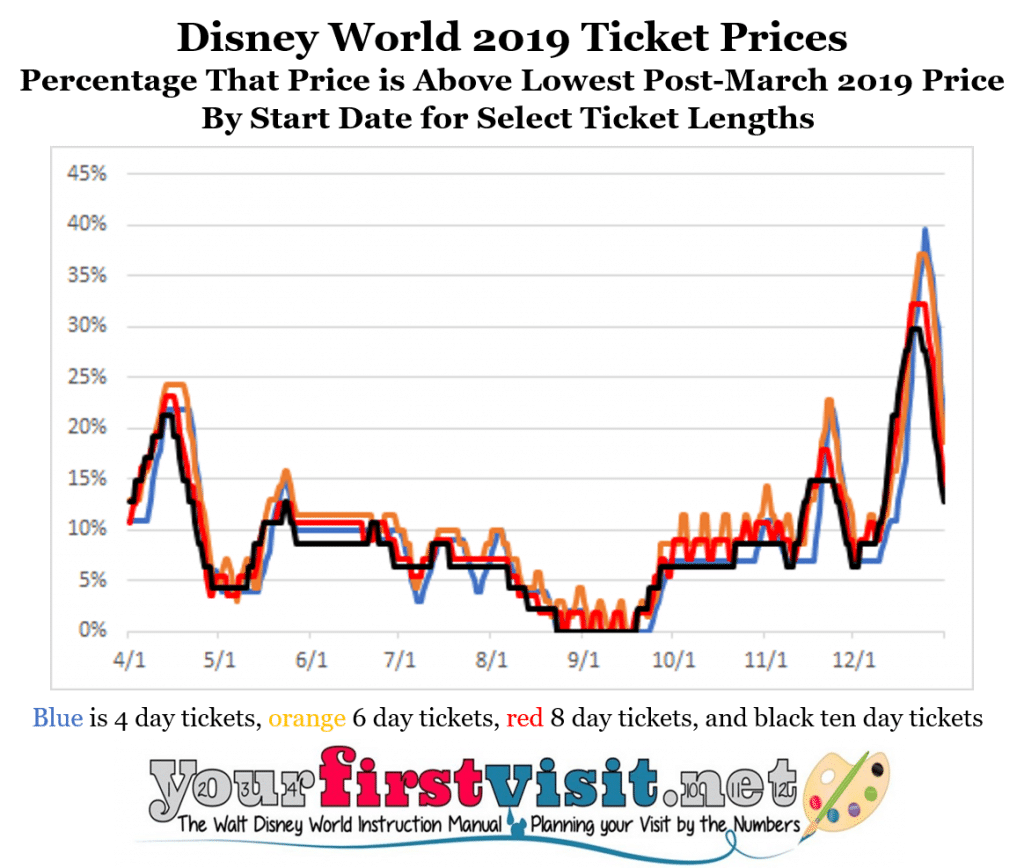
You’ll see that the most expensive tickets in the depicted lengths are now 40% higher than the lowest prices of the year. In (unshown) shorter tickets, it is 45%. At this spread, ticket prices may actually start to shift people away from higher-priced periods and into less-expensive ones.
Also worth noting is that is that you see next to no increases in the period immediately after the new Star Wars land opens. For opening day (August 29—see this) and the 30 days following, price increases average about 2%–pretty much the lowest level of price increases across the year.
Simpler minds will conclude that this is because Disney intends to offer extra cost access options these dates, or that it expects low demand. People who actually get Disney’s new date-based pricing model will understand that Disney is trying through these lower prices to incent visits to an unfinished park during an unpopular time of the year to go.
The next major event on the ticket pricing front will likely be the release of 2020 ticket prices. There’s no precedent for knowing when this will happen. I’d guess at the latest it will be early summer, but it may be earlier, and frankly no one on the outside knows.
Follow yourfirstvisit.net on Facebook or Twitter or Pinterest!!



can you give me the dates of your off season please
thank you
Reply
Hi Pamela, I’m just a guy with a website, so I personally have no off-season. The basics on when to go are here.
Reply