
How I Build My Crowd Calendars
By Dave Shute
My crowd calendars (examples below) are designed to guide first time visitors to WDW who may never return toward lower crowd weeks and away from higher-crowd ones.
My ranking system—in homage to Spinal Tap—goes from 1 to 11, and the “green” weeks (rankings 1-4) are forecast as good choices, “red” (rankings 8-11) bad, and black (5-7) in between.
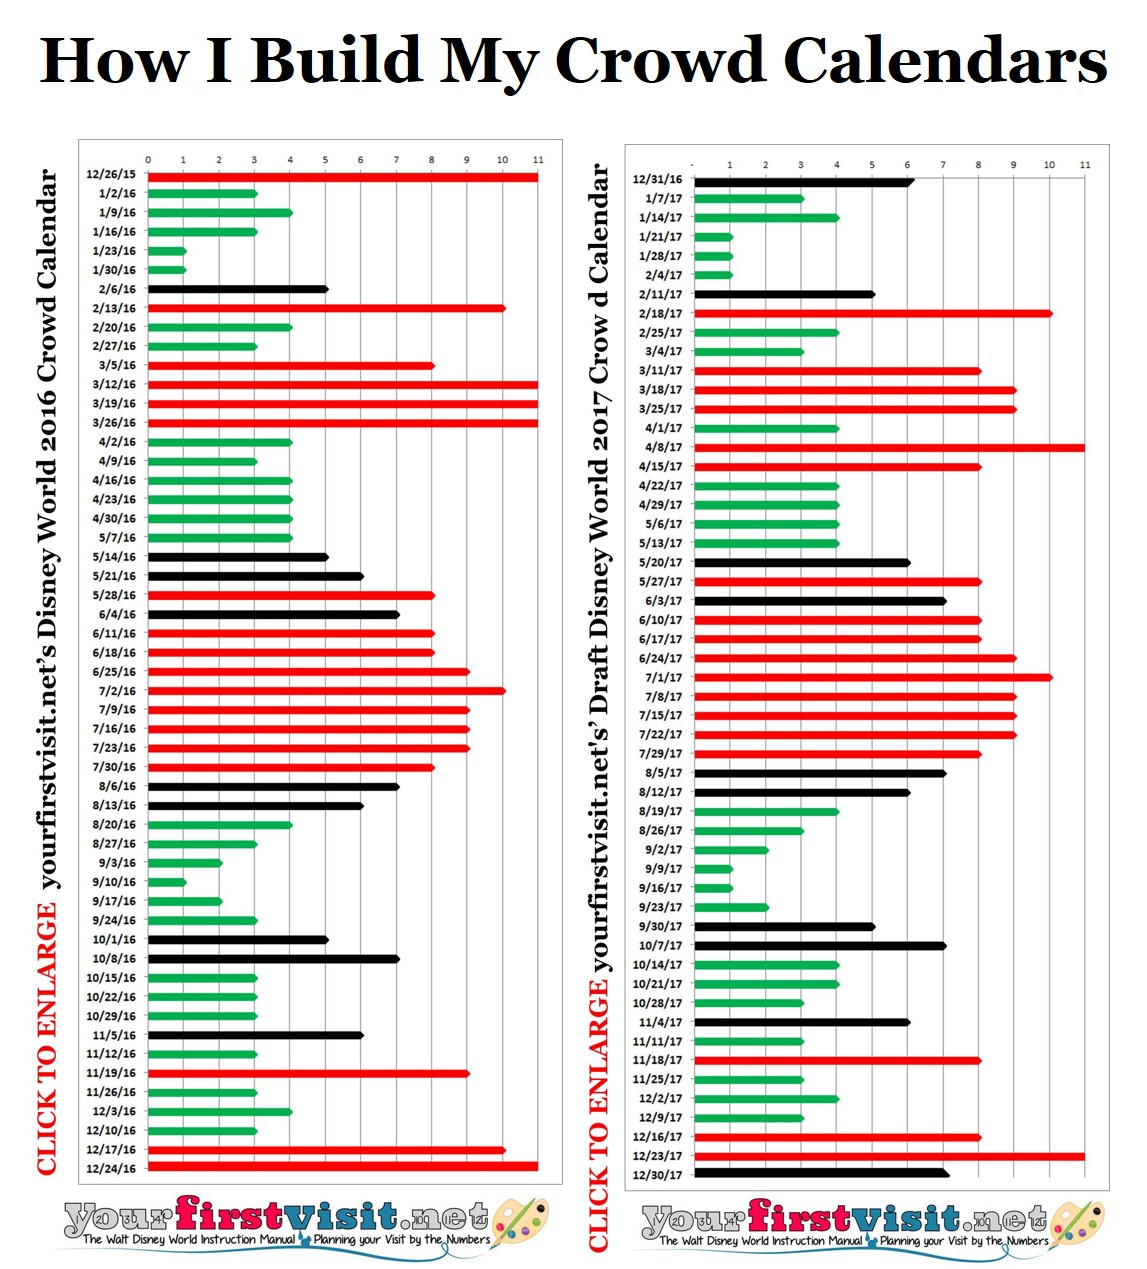
Because I don’t think it helps first timers to be wishy-washy, I don’t aim for a normal distribution, but rather put very few weeks in the “in-between” category. Thus my rankings end up compressed into 4 and below and 8 and above.
Other good crowd calendars that put more of their dates into the center of the ranking distribution will have many more weeks ranked 5, 6, and 7 than I do. The way I try to guide first timers to better weeks, what others will show as average—or even slightly above average—crowds I will show as “low.”
For the same reason, my rankings are ordinal, not cardinal. A ranking of 1 is better than a ranking of 2, but not twice as good.
Moreover they are not tied to the same numbers in prior years—a 3 this year is not the same as a 3 at the depth of the recession. Rather, simply, each year, within the year, I am forecasting that a 3 is better than a 5, and not as good as a 1.
My crowd calendar forecasts are based on two principal inputs:
- Disney World’s own crowd projections, as inferred from the variations in operating hours it offers over the course of the year, as modified by
- Annual analysis of every break longer than a three day weekend for 10 million US schoolkids, weighted based on their propensity to visit Disney World.
When I first started this site, my crowd forecasts were based entirely on variations in operating hours at Disney’s Hollywood Studios and Animal Kingdom parks. (I left out Epcot because it sees fewer many changes in hours, and the Magic Kingdom because I could not figure out how to account for the Halloween and Christmas parties.)
After a few years of building up data, I would forecast the next 6 months based on Disney’s actual schedule and the 6 months after that based on the historic patterns I’d developed, modified for moving holidays.
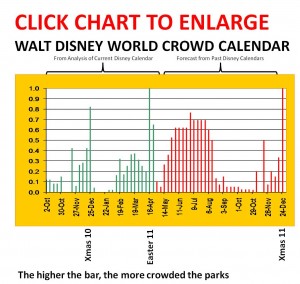
Above is an example of the results of how I used to do it.
This worked OK for a while, but was not sharp enough in distinguishing spring break weeks and the beginning and end of the Christmas/New Years rush in particular.
Moreover it broke entirely later in the last recession when Disney started showing three months of hours rather than six, and then, after it returned to six months, it started showed limited schedules for the out months, with additions to hours coming close to the actual dates.
So in response, I began supplementing my crowd calendars several years ago with annual analysis of all school breaks longer than a three day weekend in ~180 school districts. These 180 districts are the 100 largest districts in the country, supplemented by 80 more large east-of-the Mississippi districts intended to better flesh out states with only a few or no districts in the top 100.
Analytically the way I work with the districts is that I weight districts in a state by kids per analyzed district, and then weight the results for the state based on their relative proportion of visits to this site, as a proxy for geographic interest in Disney World. The state weighting corrects as well as I can for propensity to visit Disney World compared to the distribution of the 180 districts—especially the top 100—across the states.
I use the results to sharpen my forecasts for June, August, the fall, Christmas, the week of President’s Day, and spring breaks. The week of President’s Day and spring breaks are particularly tricky because of higher visitation from snow-birds than either operating hours or school calendars would imply, but with experience I’ve gotten closer on these.
That last point suggests the role of judgement. In a Bayesian sense, my draft Crowd Calendars are the prior based on history, and they then get modified based on the results of the school break analysis, my recent experience (30-60 days in the parks a year, at all different times of the year), history, judgment and help from others—particularly Josh of easyWDW and Carl of Dad’s Guide to WDW and WDW Magazine. (Josh and I co-author The easy Guide to Your First Walt Disney World Visit and within it co-create the crowd material it forecasts, and Carl and I co-author an annual crowd forecast in WDW Magazine.)
There’s no perfection in any forecasting, and I do make mistakes, especially about spring break crowds, where I get a week significantly wrong (more crowded than I predict) on average about once every two years.
Any fool can say “don’t go to Disney World in March or April” and take no risk of complaints. Instead, I try to find spring break weeks that are actually good. Rarely are my suggested spring break weeks ones that have no kids on break—rather, they are ones that are 1. before or after the March snowbird influx that 2. also have relatively few kids on break compared to the mass-break weeks in later March and before and after Easter.
There several ways these forecasts can go wrong.
First is sampling error—that the 10 million kids I analyze aren’t representative of the 40 million I don’t. This is particularly a potential issue when I use city school district calendars as the proxy for a state, and miss different breaks in its surrounding suburbs. These different breaks won’t matter if they match weeks that are already lousy, but they will matter if they match weeks where few of the 180 districts I currently analyze have breaks. I’ll be sharpening this up for 2017.
Second is a change in Disney operations. My forecasts assume that operating policies remain similar year to year. If Disney cuts staffing and per-hour capacity, waits will shoot up even on a day when an average number of people are in the parks.
Third is a differential change in propensity to travel on a given set of dates. There’s a couple of ways this could happen.
- One is a one-time effect from weather. For example a much warmer northeastern winter, or a winter with so much snow that northeastern travel shuts down, may push people from January and February into March and April, because they either don’t need the winter break as badly, or, despite how they need it, transportation shuts down.
- Fall breaks are another possible driver of changes in propensity to travel on a given set of dates. I can’t document that they are a lot more common than they were a few years ago, but what may be happening is that more people are realizing that they are a better time to go to Disney World than the traditional holiday seasons.
This raises another point. My Disney Experience and FastPass+ have made the internet an essential part of a Disney World experience, rather than an optional one. This, plus the fact that the core Disney World first-time planners (parents in their 30s) are in the “always knew about Google” generation may mean that more people may be searching for better and worse times to go, and acting on the advice they find, thus shifting the propensity to travel at certain times.
The final issue any crowd calendar faces is a mismatch of expectations and reality.
All the time I get comments along the lines of “Hey, you said last week was a low crowd week, but we waited 30 minutes Wednesday afternoon for Pirates of the Caribbean! You made a terrible forecast.”
Well, these days an afternoon standby wait of 30 minutes for Pirates is a marker of a low crowd day…

Follow yourfirstvisit.net on Facebook or Google+ or Twitter or Pinterest!!


0 comments
Comment by typing in the form below.
Leave a Comment | Ask a Question | Note a Problem